
Switching LLM Accounts at 88% — Manually First, Then Automatic Failover at 80%
I saw the primary account hit 88% on Grafana, worked out when it would run dry, and switched by hand at dawn when nobody was publishing. Then I gave the accounts an order so the sub only takes traffic when the primary is empty or over its limit.
On this page
Introduction
NOTE
The service I own generates blog post bodies with an LLM. It runs on a subscription account rather than a metered API key, and subscriptions come with a weekly quota. Once that quota is full, no posts come out until the next reset. Users had posts scheduled throughout the day, so when the account hit 88% I caught it and switched to the sub account at dawn, while nothing was generating. It now moves to the sub on its own once the primary crosses 80%.
Users set the schedules. Each blog has a cron, and a worker generates and publishes posts at those times. Since no human sits in the loop, a full quota doesn’t announce itself. The scheduler is fine, the queue is fine, only the output stops — and you find out in the morning when the publish list is empty.
Switching accounts carries a similar constraint. It means restarting the proxy that handles authentication, and any post being generated at that moment fails. So the switch had to happen before the quota filled and while nothing was generating.
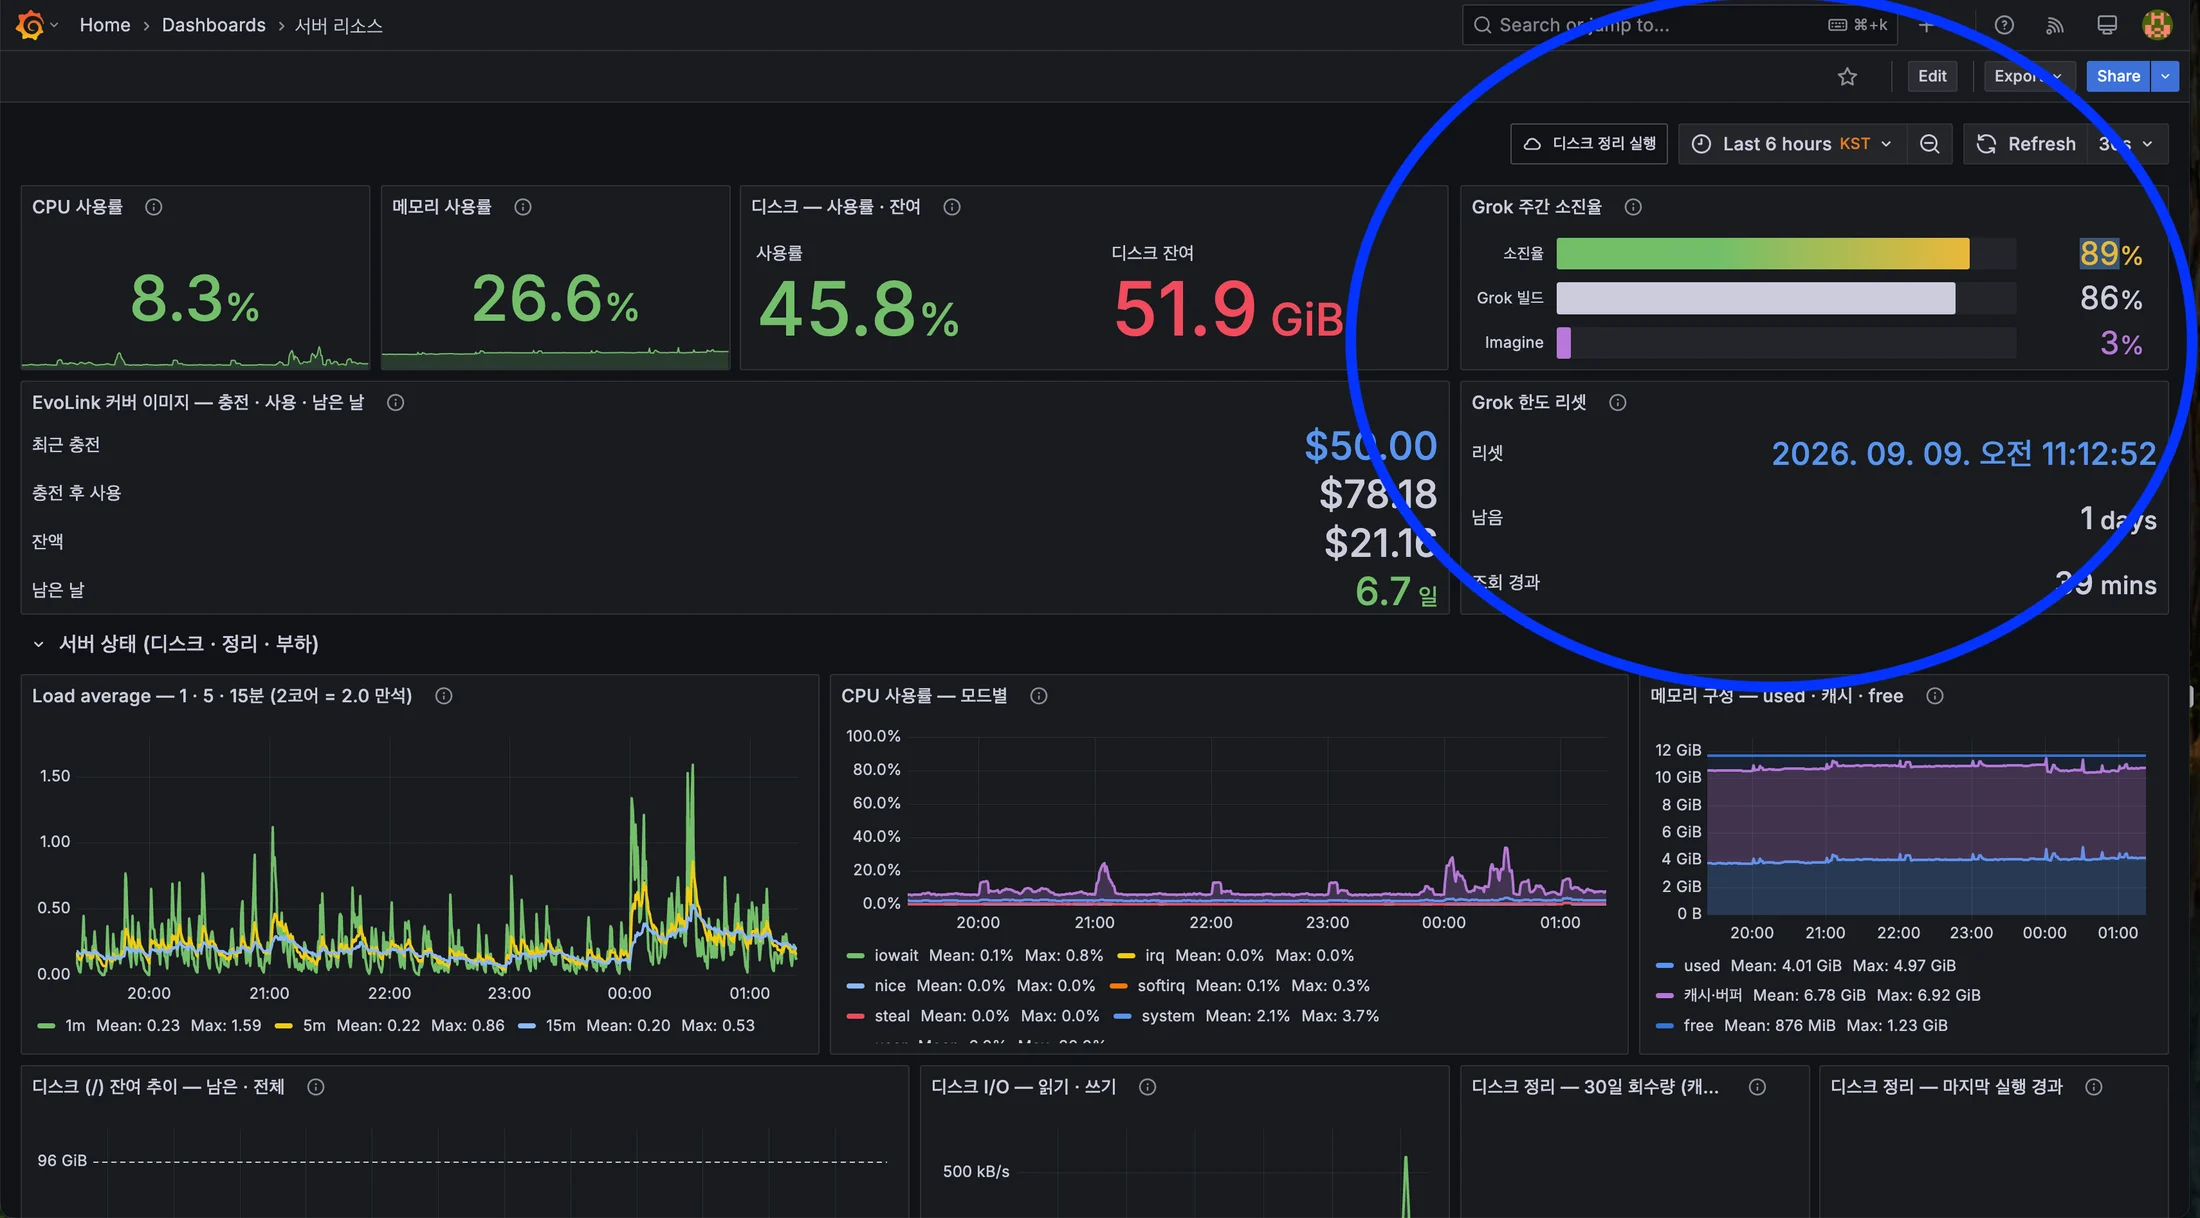
I checked the dashboard at dawn and the primary account was at 88%. This post starts there: working out when it would run dry, switching by hand while nobody was publishing, and then giving the accounts an order so the failover happens on its own.
1. Planning the switch at 88%
The weekly quota resets at the same time every week. It was at 88% then (89% by the time I finished checking), with 33 hours left before reset. One question mattered: would the remaining 12% last 33 hours?
Count generation time, not publish time
Each blog has a cron, so the number of upcoming posts is countable from the schedule. There’s a catch though.
// pre-generation lookahead (6h default): schedules due within this window are generated early.const PREGEN_LOOKAHEAD_MS = Math.max( 0, Number(process.env.PREGEN_LOOKAHEAD_MS ?? 6 * 3600_000),);Posts are generated six hours before they publish. Tokens are spent at generation time; publishing just ships something that already exists. So to know how much gets spent between now and noon, you count the posts that will be generated by noon, not the ones that will be published — the ones going out between 06:52 and 18:00.
I noticed it because last_run_at in the database sat exactly six hours earlier than the cron time. Counting by publish time would have shifted the whole window.
Count topic inventory, not the cap
Schedules have a posts_per_run ceiling. Add those up and the window holds 57 posts. In practice it doesn’t produce anywhere near that.
-- topics a schedule can actually pick upSELECT count(*) FROM topics t WHERE t.site_id = $1 AND t.status = 'verified' AND t.content_plan_status IN ('ready', 'not_requested') AND NOT EXISTS (SELECT 1 FROM posts p WHERE p.topic_id = t.id)The scheduler picks up topics in verified state. A blog with no inventory runs its schedule and produces zero. Counting inventory instead gave 15.
| Count | |
|---|---|
| Schedule runs | 39 |
posts_per_run total | 57 |
| Actual, inventory-adjusted | 15 |
Two ×10 schedules had zero inventory and were spinning empty. Yesterday’s schedule_runs over the same window showed 15 actually enqueued out of 39 runs, which matched.
Check the account you’re switching to
Before switching I looked at the sub account.
- Same subscription plan? It had to be the same SuperGrok Heavy for the quota size to match. A different plan invalidates every calculation.
- Is anyone using it? If usage isn’t 0%, switching buys less.
- When does it reset? To alternate between two accounts you need to know whether the cycles are offset or aligned.
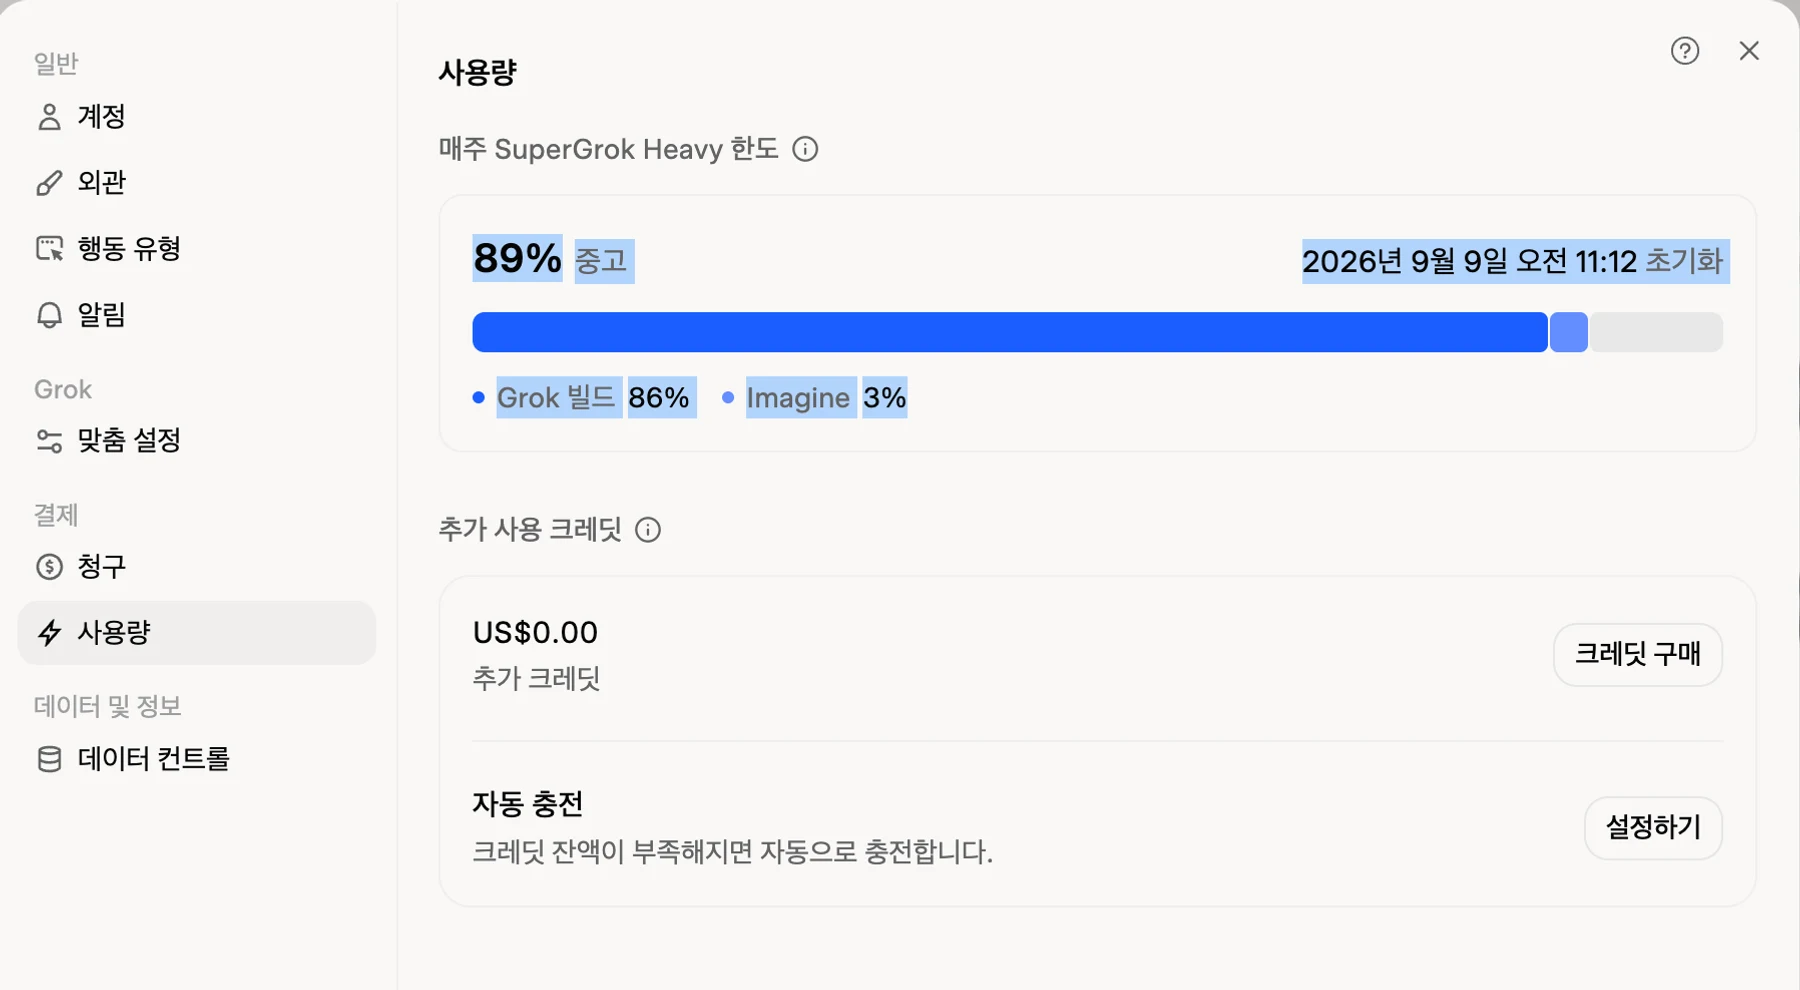
The plan name, the usage, the reset time — they only exist on this screen. Personal subscriptions have no public API, so checking means looking at the console. Later I end up mimicking the request this screen makes.
It turned out to be the same plan at 0%, resetting three hours after the primary. The cycles almost overlap, so alternating to cover a gap doesn’t work — but the weekly total doubles.
Noon is fine, so there’s no rush
Stacking up measured hourly consumption put noon at around 94%. Not urgent. And if it isn’t urgent, there’s no reason to switch at an arbitrary moment — pick a time when nothing is generating.
2. One account was never going to be enough
While doing the arithmetic something more important turned up.
The account had burned 88% over the 5.57 days since the cycle started. That’s roughly 16 percentage points a day.
16pp/day × 7 days = 112pp/week ← demandone account's quota 100ppWeekly demand exceeds the quota. Sitting at 88% wasn’t bad luck — it was going to happen every week.
That changed what this job was. Not “switch once to get through tonight” but “give the accounts an order so traffic moves on its own when one runs dry.” Two accounts make 200pp, which leaves 1.8× headroom against 112pp of demand.
IMPORTANT
The sub account’s 100% for that week was about to vanish with the reset 33 hours later. It had gone unused the entire week. Since unused quota is simply lost, “save the primary’s remaining 12%” wasn’t a real calculation.
That settled it. The question wasn’t about saving anything, it was about reducing risk — and moving to an account at 0% right now was the better side of that trade.
3. Why I delayed the automation, and why that was right
I could have built the automatic switch right there. I didn’t.
There was no way to validate the trigger
Automatic switching comes down to a machine deciding when to move. The obvious signal is a quota-exceeded response. To use it as a condition, you need to know what that response looks like.
sum by (code) (increase(llm_http_responses_total{lane="grok"}[7d]))→ code="200" onlySeven days, and not a single code other than 200. There was no recorded instance of what arrives when the quota fills. You can write the condition, but you can’t confirm it’s right. And it fails in two directions.
| Wrong direction | Result |
|---|---|
| Too dull | The switch never fires and posts fail. More code, same outcome as none |
| Too eager | A momentary rate limit reads as an exhausted quota, burning a healthy account |
Automating it doesn’t save any human effort
Getting a token for the sub account requires an interactive login no matter how you design it. It’s browser OIDC; there’s nothing to automate. Finishing the automatic switch first leaves that step exactly where it was. What you actually save is two commands.
rm ~/.grok-proxy/token.jsonsudo systemctl restart xai-proxyThere’s no reason to push unvalidated code into the only path post generation travels, at dawn, to save those two lines.
The steps I took
So I did it by hand.
① Pick a moment with zero posts in flight. I watched llm_inflight and the queues for a window where nothing was generating. The next generation block was 80 minutes out.
② Back up the live token. This is where the trap was. OIDC refresh tokens rotate — refresh once and the previous one is dead. So the token in the auth.json the CLI wrote was already dead; ours was dated June. The live one lived in the proxy’s state file.
③ The state file is the source of truth. The proxy works like this.
def _load_state(): if os.path.exists(STATE_FILE): return json.load(open(STATE_FILE)) # ← if present, only this is read d = json.load(open(GROK_AUTH)) # ← seeded from here only when absentLogging into auth.json with a new account does nothing at all. The state file has to be deleted before it gets read again. Flip that around and it means logging in while leaving the state file alone keeps production running untouched — the login step doesn’t move production at all, and there’s exactly one file to revert.
④ Personal and Team are different wallets on the consent screen. The device authorization screen has a Personal / Team toggle. Picking Team makes the team the principal, which spends the team’s metered credits instead of the personal subscription’s weekly quota. That erases the point of switching and adds a bill.
I opened the existing token to see which one it was before proceeding.
principal_type = User ← not Teamprincipal_id = <user_id> ← not team_idteam_id = <present> ← the field has a value, but the principal is Userteam_id having a value makes this confusing. principal_type is what decides the principal.
The screen lied the moment I switched
The swap went fine. The proxy attached with the new account’s token and real calls came back 200. Then I looked at usage: the new account was at 0%, but the screen still showed the old account’s 90%.
The cause was the collector’s parser. The usage response is protobuf, and proto3 doesn’t serialize default values. On an account at exactly 0%, that field simply isn’t there.
# total usage is the 4 bytes after f1 (0x0d)if (ratio < 0 && B[i] == 13) { ratio = f32(B[i+1], B[i+2], B[i+3], B[i+4]) }...if (ratio < 0 || ratio > 100) exit 1 # ← missing means failureThe parser treats a missing field as failure. On failure the collector writes nothing, which leaves the last successful value sitting in the file. That 90% on screen was a stale value from the old account.
WARNING
What makes this failure nasty is that the screen doesn’t go blank. You notice when a value disappears; when an old value stays, you read it as current. A similar incident happened before on this project — a four-hour-old balance read as the current balance and drove a decision.
Whether the response is valid comes down to the reset time. Even a 0% response carries it. If the gRPC frame length checks out and the reset time parses, the response was read correctly, and a missing usage figure is 0, not a failure.
valid = 0if (n > 5 && B[0] == 0 && reset > 0) { mlen = B[1]*16777216 + B[2]*65536 + B[3]*256 + B[4] if (mlen > 0 && n >= mlen + 5) valid = 1}if (ratio < 0 && valid) ratio = 0 # absent means zeroif (ratio < 0 || ratio > 100) exit 1 # broken frame still fails, as beforeA broken frame or a missing reset time still fails the way it used to. It won’t invent a 0 out of login HTML or noise. I captured a real 0% response as a fixture and pinned it in the tests.
Had I built the automatic switch first, it would have been making decisions on top of that lie. Reading 90% for an account at 0% means deciding the threshold was crossed and immediately moving off the account I’d just switched to — at dawn, with nobody watching.
4. How the automatic switch works
With the observability fixed, I put the automatic switch in.
Give the keys an order
Order matters more than the threshold. The accounts sit in a priority list, and every request starts reading from the first one again.
def order(self, now):    """Reading from index 0 every time is what makes a reset account come back on its own."""    usable = [a for a in self.accounts if not a.blocked(now)]    if usable:        return usable + [a for a in self.accounts if a.blocked(now)]    # even with everything blocked, don't give up — take the least full one    return sorted(self.accounts, key=lambda a: a.ratio())
def blocked(self, now):    if self.cooldown_until > now:              return "cooldown"    if self.quota["ratio"] >= QUOTA_THRESHOLD: return "quota"
Three things follow from this.
- The sub only takes traffic when the primary is empty or dry. While the primary is healthy the sub sits behind it in the order and never gets used.
- Coming back needs no code. When the primary resets,
blocked()returnsNoneand the next request goes back to it on its own. - It doesn’t stop even when everything is blocked. That’s what the last line is for. Raising there would kill post generation outright.
The threshold sits at 0.80. Pushing to 100% is dangerous: post bodies have no fallback on this path, so a full quota means failure after three retries. Images survive because they fall back to a different engine.
TIP
The threshold is not a hard cap. If every account is over it, the least full one keeps serving. It’s a priority signal that says “move on to the next account if you reasonably can,” not “stop here.”
Two signals, primary and safety net
Two signals drive the decision.
| Signal | Role |
|---|---|
| Usage (primary) | Read ahead of the request so an account over the threshold is never picked |
| Response (safety) | If a quota-shaped response arrives anyway, cool that account down and move on within the same request |
Usage is the primary signal for the reason above: with no recorded quota-exceeded response, the response alone can’t be validated. That doesn’t mean trusting usage alone either — the lookup path is unofficial and could close at any time.
A failed lookup doesn’t block the account. If it can’t be read, it stays unread and we move on (fail-open). Halting post generation because usage couldn’t be read costs far more.
Rotating tokens decided the architecture
Showing both accounts side by side on the dashboard ran into one constraint.
Reading usage requires that account’s access token, and access tokens are refreshed with a refresh token — which rotates on every use. So exactly one thing may refresh a given account’s token. Two refreshers invalidate each other.
That’s why the collector can’t read the inactive account’s usage. Reading requires refreshing, and refreshing collides with the proxy.
proxy ── owns tokens · refreshes · reads usage ──▶ per-account metrics file │collector ──────────── only moves it ───────────────────────┘The proxy goes as far as producing Prometheus text, and the collector moves it into the textfile directory. No nested JSON parsing in shell, no new scrape target.
At first I left the parser in the collector too. I thought two copies would validate each other. They don’t. The switch runs on the proxy’s parse and the screen draws from the collector’s parse, so if they diverge you get a state where the screen looks fine but the switch isn’t happening — and that isn’t something you catch by looking. It turned out neither the panels nor the alerts were reading what the collector emitted. I removed the parser and the 386 lines around it and folded everything into the proxy.
CAUTION
Deleting the code isn’t enough. The volume holding the metric files stays behind, and unless those files are removed the collector keeps exporting stale values forever. You notice when a value disappears; when an old value stays, you read it as current. Same failure as earlier in this post. It now clears them once at startup.
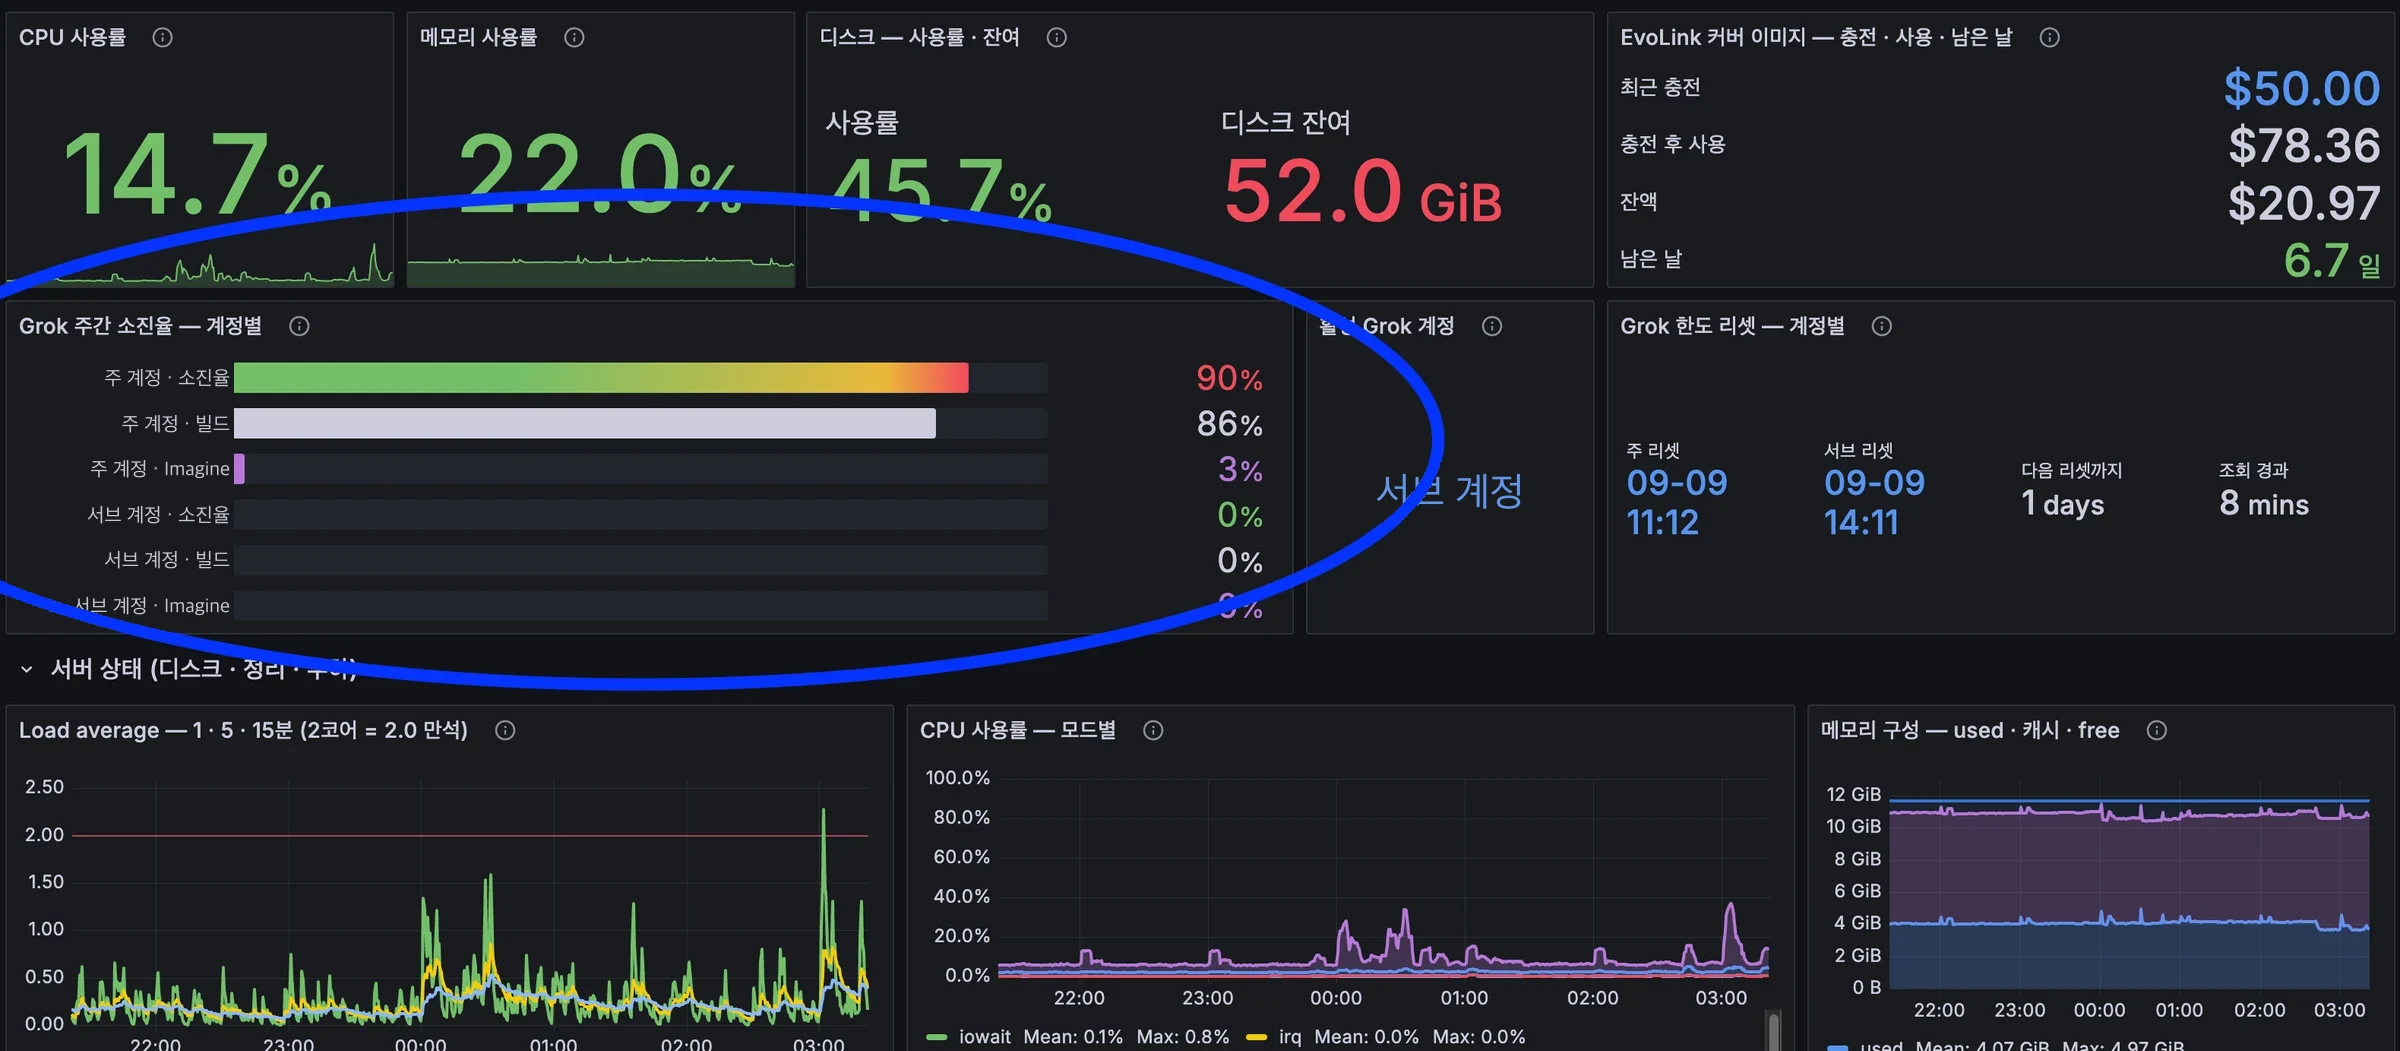
One more thing became necessary. When the account changes, the usage curve drops straight from 90% to 0%. Without something explaining that step, you look at the graph later and assume collection broke. So which account is currently serving goes on the same screen.
Alerts only fire on failure
The switch itself isn’t announced. It’s normal behavior that happens a few times a week because of the weekly quota, and mailing it out buries the real incidents.
There are three ways the switch fails, and since the response differs for each, there are three rules.
| Rule | Condition | Level | Meaning | Response |
|---|---|---|---|---|
| no-target | Every account blocked | Critical | Nowhere to go | Cut publishing or add an account |
| account-down | One account can’t get a token | Warning | Can’t move to that account | Log in again |
| blind | Usage collection has stopped | Warning | Can’t tell when to move | Check the proxy |
Two things needed care.
It’s min, not max. One account reaching its limit is normal — that’s why there are two. With max it fires all the time, and an alert that’s always on hides the real problem.
It has to fire when the metric disappears, too. If the proxy dies the metric goes away entirely, and an empty result means the condition is never evaluated and passes quietly. That’s the most dangerous silence.
expr: (time() - max(grok_account_quota_updated_seconds)) or vector(999999)noDataState: AlertingConclusion
The first generation block on the night of the switch went through without errors.
Published 9/9 succeededGrok calls text 45 · image 3 — all 200Failure rate 16% (normal range 7–21%)Proxy errors noneI confirmed the automatic switch in both directions. I never specified an account, only changed the threshold.
| Threshold | Account that took the request |
|---|---|
| 0.80 | Sub (primary at 90% > 80%, skipped) |
| 0.95 | Primary ← came back on its own once eligible |
| 0.80 | Sub |
The switch history the proxy left behind. reorder means the proxy decided on its own.
17:01 primary(0.90) → sub(0.00) mode=manual ← by hand17:30 primary(0.90) → sub(0.00) mode=reorder reason=quota17:42 sub(0.00) → primary(0.90) mode=reorder ← back once eligible17:43 primary(0.90) → sub(0.00) mode=reorder reason=quotanote
It leans on an unofficial lookup path. Personal subscriptions have no public API, so it calls the same gRPC-Web endpoint the console uses. A change in the response shape breaks the lookup. That’s why it’s fail-open: the service keeps running, only the switching decision goes stale, and the blind alert says so.
Detection lags by up to five minutes. Usage is cached. At the current burn rate that’s 0.04 percentage points over five minutes, effectively nothing — but it’s a number to revisit if publishing volume grows a lot.
The reactive path has never fired in production. No quota-exceeded response has ever arrived, so that path is covered by tests only. It isn’t a problem while the primary signal carries the load, but it’s worth knowing it’s unvalidated.
Comments