
Scaling QPS 10x in Production: 3 Strategies That Actually Move the Needle
"Make it faster" sounds vague. It isn't — it comes down to the same three moves: caching, database optimization, and pulling non-essential work out of the request.
On this page
- Introduction
- First, what is QPS
and why does it hit a wall?
- 1 Caching
“Never compute the same thing twice”
The ideaMulti-layer cachingThe genuinely hard part: what to cache and for how long💡 What I shipped — the “view-count batching” on 3w CMS - 2 Database optimization
- 3 Async + batching
- Conclusion
Introduction
“Make it faster” sounds like a vague mandate. It isn’t. Performance work turns out to be one of the most learnable parts of backend engineering, because it almost always comes down to the same three moves. These are the three I shipped in production — and they took our QPS up more than 10x.
Let me walk through them the way I actually think about them now: why the bottleneck exists → how to fix it → how much it actually moved the needle.
First, what is QPS — and why does it hit a wall?
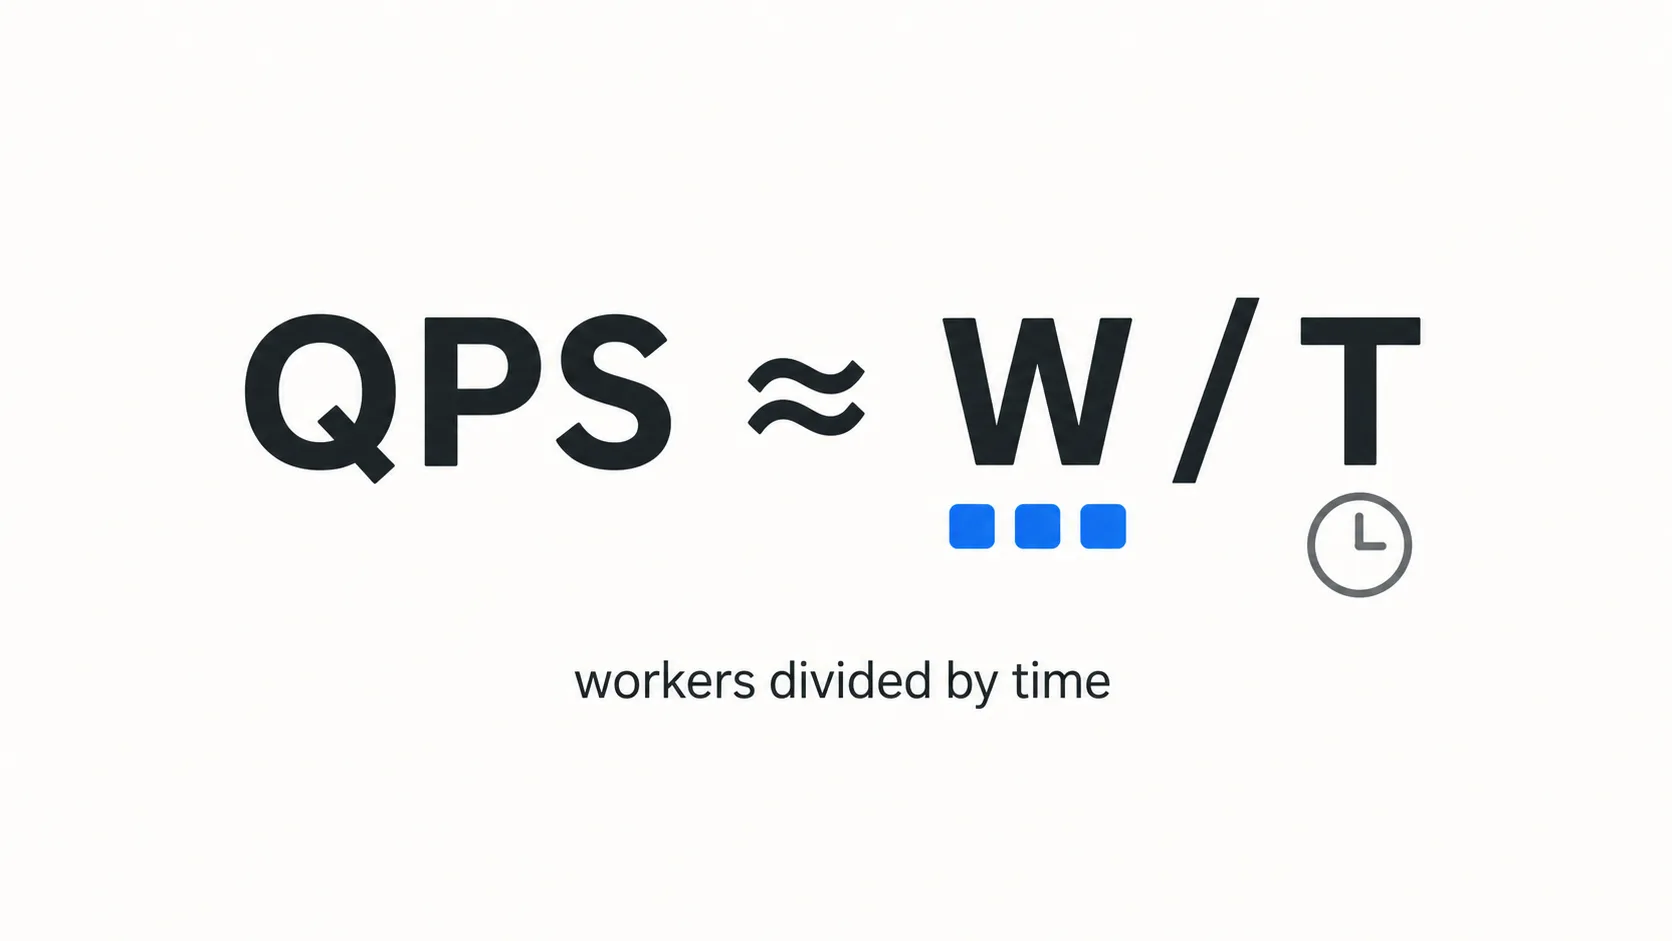
QPS (Queries Per Second) is just how many requests you handle per second. But you can’t will it higher. It’s bound by a formula:
QPS ≈ number of concurrent workers / time to process one requestThe checkout counter analogy makes this click. Think of a worker (a thread or a connection) as a cashier, and request-processing-time as how long it takes to ring up one customer.
-
1 cashier, 0.5s per customer → 2 customers/sec = 2 QPS
-
Speed them up to 0.1s per customer → 1 cashier now does 10 QPS (you shrank the denominator)
-
Add 2 more cashiers → at 0.1s each, 30 QPS (you grew the numerator)
QPS = cashiers / time-per-customer → 3 / 0.1s = 30 QPSThe trouble starts when customers pour in faster than that. Hit a 30-QPS shop with 40 customers per second, and the line grows by 10 every second → wait times explode → customers walk out (timeouts) → the shop seizes up (an outage). Servers behave exactly the same way.
So there are only two ways to raise QPS:
-
Shrink the denominator (time per request) → caching, DB optimization
-
Pull work out of the denominator — anything that doesn’t have to happen inside the request → async / batching
The three strategies below attack exactly these two levers. And in practice, whenever you start tuning, you reach for them in this order — it’s the order of best bang-for-buck: Caching → DB optimization → Async/Batching.
1. Caching — “Never compute the same thing twice”
The idea
Caching is fundamentally about storing the result of an expensive operation in a cheap place and reusing it for a little while. The two words that matter are expensive and a little while.
How expensive? The response-time gap is why caching is the #1 bang-for-buck optimization:
| Data source | Rough latency | vs. DB |
|---|---|---|
| Application memory (in-process) | ~0.001ms | ~50,000x faster |
| Redis (same network) | ~0.5–1ms | ~50–100x faster |
| DB, simple query (indexed) | ~10ms | baseline |
| DB, complex query (JOIN/aggregation) | ~50–200ms | — |
So if a result took 50ms to fetch from the DB once, caching it in Redis means you can return it in ~1ms from then on. The per-request time (the denominator) drops by 50x — and QPS jumps right along with it.
Multi-layer caching
In production you rarely use just one cache. You stack layers, and the closer to the user you can stop the request, the better. In the order a request travels through them:
User request │ ▼① CDN cache (CloudFront/CloudFlare) ← if it hits here, it never reaches your server (best) │ miss ▼② App memory cache (in-process LRU) ← 0.001ms, but lives per-server │ miss ▼③ Redis (distributed cache) ← 1ms, shared across all servers │ miss ▼④ Database (the source of truth) ← 50ms; reaching here is a "cache miss"-
① CDN — static assets (images, JS, CSS) or public API responses that don’t change. It ends at an edge near the user, so your servers don’t even see the traffic.
-
② App memory — fastest, but independent per server: 10 servers means 10 copies and painful invalidation. Best for tiny, rarely-changing data (exchange-rate tables, shared codes).
-
③ Redis — shared by all servers, so invalidation is one shot. The workhorse of production caching.
Heads-up on naming: some texts call these L1 (app memory) / L2 (Redis) / L3 (DB or CDN). There, the numbers go by closeness to the data/CPU (L1 is closest to the app), which is the opposite direction from the request-flow numbering above (①CDN first). It’s easy to mix up, so I numbered purely by request order here.
The genuinely hard part: what to cache and for how long
Writing cache code is easy. The hard part is the TTL and invalidation strategy. There’s a reason for the old joke that the two hardest problems in computer science are cache invalidation and naming things.
Strategy depends on the nature of the data:
| Data | Change frequency | Strategy | Why |
|---|---|---|---|
| Forum post list | Occasionally (new post) | TTL 5 min | A 5-minute-stale list is fine |
| Product detail | Occasionally | Invalidate on write | Price changes must show immediately |
| My profile | Only I edit it | TTL 30s or invalidate on write | Not seeing my own edit feels like a bug |
| Live inventory | Very frequently | Don’t cache / 1s TTL | Wrong value → oversell incident |
Invalidate-on-write pattern:
// Read: cache first, fall back to DB, then populate the cache (cache-aside)async function getProduct(id: string) {  const cached = await redis.get(`product:${id}`);  if (cached) return JSON.parse(cached);          // cache hit → 1ms
  const product = await db.product.findUnique({ where: { id } }); // miss → 50ms  await redis.set(`product:${id}`, JSON.stringify(product), "EX", 300); // 5-min TTL  return product;}
// Write: update the DB, then DELETE the cache (next read repopulates it)async function updateProduct(id: string, data) {  const product = await db.product.update({ where: { id }, data });  await redis.del(`product:${id}`);   // ← invalidation. This one line is the point  return product;}
⚠️ Common mistake: after a write, deleting the cache (
del) is usually safer than updating it (set). If two writes update concurrently, a stale value can win the race; deleting means “fetch fresh from the DB next time,” which always reflects the latest state.
💡 What I shipped — the “view-count batching” on 3w CMS
A post’s view count is the textbook “read-heavy, accuracy-doesn’t-really-matter” kind of data. But the original design fired a DB UPDATE on every single view.
Before — 1 view = 1 write query:
-- runs every time someone opens a postUPDATE posts SET view_count = view_count + 1 WHERE id = ?;The problem: a popular post getting 500 readers/sec means 500 write queries per second hammering the same row. Concurrent UPDATEs on one row create row-lock contention, so bumping a view counter ends up slowing the entire DB. Writes can’t be cached and can’t be offloaded to replicas — it’s the most painful kind of load.
After — Redis counter + a 5-minute batch flush:
// On view: increment a Redis counter, not the DB (0.5ms, no lock)await redis.incr(`view:post:${postId}`);
// A job every 5 minutes: collect and apply to the DB in one shotasync function flushViewCounts() {  const keys = await redis.keys("view:post:*");  for (const key of keys) {    const postId = key.split(":")[2];    const count = await redis.getdel(key);  // read value and delete atomically    await db.post.update({      where: { id: postId },      data: { viewCount: { increment: Number(count) } },    });  }}
Result: 1,500 views over 5 minutes hit the DB as a single UPDATE. Write load dropped by 1,500x. The count can lag by up to 5 minutes, but for view counts that delay is completely harmless — the trade-off is a perfect fit.
This is caching (temporary storage in Redis) fused with batching (collect, then flush once) — which leads straight into strategy #3.
2. Database optimization — where 80% of bottlenecks live
Application code usually runs in microseconds, but the DB operates in milliseconds to hundreds of milliseconds — so most backend bottlenecks happen at the DB. That’s why it’s the next thing you touch after caching. Three things come as a set.
The big premise: the fastest query is the one you never ran. The #1 priority in read optimization isn’t writing a clever query — it’s reducing how often you reach the DB at all. So in practice, before hitting the DB directly, you filter reads in this order:
Can the cache answer it? — the multi-layer cache from #1 stops a large share of reads before the DB. Hot data barely reaches it.
Can several queries collapse into one? — fold N+1 into an IN-query / JOIN / DataLoader (see batching in #3). 11 round-trips → 2.
Are you fetching only what you need? — specific columns instead of
SELECT *, paginate to cap rows, drop needless JOINs.So the index/pool/replica below are there to serve the queries that still have to reach the DB after all that filtering — quickly and reliably. “Run fewer queries” always comes before “run queries faster.”
2-1. Index optimization — “the index at the back of a book”
Without an index, the DB has to read the table from start to finish (a Full Table Scan) to find the rows you want. A million rows means scanning all million. An index is like the index pages at the back of a book — a pre-sorted structure (a B-Tree) that says “this value is on page N.”
A table and an index are not the same thing. The table is the original data (the book’s body); the index is an auxiliary lookup to find it fast (the back-of-book index pages).
An index isn’t new data — it’s a derived copy of select columns, sorted. Drop it and no data is lost; only search gets slow again → so you add/drop them freely, even in production.
When you insert new data, the DB automatically updates the table and its indexes together. ↔ This is exactly why “too many indexes slow down writes.”
One table can have several indexes for different search patterns, and the DB picks the most useful one per query. (This is why the same SQL can be fast or slow depending only on which indexes exist.)
Concrete example — fetching one user’s orders from a 100k-row table:
SELECT * FROM orders WHERE user_id = 'u_123' ORDER BY created_at DESC LIMIT 20;-
No index: read all 100k → filter by user_id → sort. ~120ms.
-
Index on
user_idonly: finds that user’s orders (say 500) fast, but still sorts in memory. ~15ms. -
Composite index
(user_id, created_at DESC): find and sort finish inside the index at once. ~0.5ms. 👈
Column order in a composite index matters. (user_id, created_at) is ideal for “narrow by user_id, then sort by created_at,” but it can’t serve a query that searches by created_at alone. The rule of thumb: equality (=) columns first, range/sort columns last.
⚠️ Trade-off: indexes aren’t free. Every INSERT/UPDATE has to update the indexes too, so writes get slower and you use more storage. Slapping an index on every column “just in case” backfires. Look at your actual query patterns and add only what you need.
2-2. Connection pooling — “don’t open a new connection every time”
Opening a new DB connection costs tens of milliseconds (a TCP handshake + authentication). Doing that per request is absurd when the query itself is 1ms — you’d burn 30ms on the connection alone.
A connection pool pre-creates N connections and lends them out and takes them back for reuse.
[req A] ─┐ ┌─ [conn 1] ─┐[req B] ─┤ Pool (reuse) ├─ [conn 2] ─┤── DB[req C] ─┘ └─ [conn 3] ─┘ (wait queue)Sizing the pool — too small and too big both hurt:
-
Too small: requests queue up waiting to borrow a connection → latency.
-
Too big: the DB sees a flood of concurrent connections → its memory/CPU blows up, since each connection costs the DB memory.
-
Rule of thumb: start around
CPU cores × 2–4and tune with load tests.
As you add app servers, each holds its own pool, so total DB connections multiply — which is why you often put a pooler like PgBouncer in front as an extra layer.
2-3. Read replicas (read/write splitting)
Most services have a read:write ratio of 9:1 or higher (write one post, hundreds read it). So spreading reads across several replicas takes a huge load off the single master.
┌─ writes (INSERT/UPDATE/DELETE) ─→ [Master DB][application] ──┤ │ replication └─ reads (SELECT) ─→ [Replica 1] [Replica 2] [Replica 3]Effect: with reads split across 3 replicas, the master focuses on writes, and read capacity effectively triples.
⚠️ Replication lag: data written to the master takes anywhere from a few to a few hundred milliseconds to copy to the replicas. So a read-after-write case (e.g., post a comment, then immediately view the comment list) will read from a replica and show “wait, where’s my comment?” Those reads must be forced to the master.
// Normal reads go to a replicaconst posts = await readClient.post.findMany(...);
// Reads that must reflect a just-made write go to the masterawait writeClient.comment.create({ data });const comments = await writeClient.comment.findMany(...); // read from master
How the three connect
These aren’t separate — they’re one bundle: indexes make a single query fast, the pool removes connection waste, and replicas spread out the reads. Cut a query from 100ms to 1ms with an index, and the same pool can now serve 100x more requests — so the three effects multiply.
3. Async + batching — “pull everything non-essential out of the request”
If #1 and #2 were about making each task faster, #3 is the mental flip: take the task out of the user’s critical path entirely.
3-1. Async processing via a message queue
Think about signup. From the user’s perspective, “signup complete” means the user exists in the DB — that’s it. But if you send the welcome email (an external SMTP call, 500ms) synchronously inside that request, the user just sits there waiting for an email to send.
Before — synchronous (signup API takes 510ms):
async function signup(data) { const user = await db.user.create({ data }); // 10ms await sendWelcomeEmail(user.email); // 500ms ← the user waits on this return user; // 510ms total}After — enqueue and respond immediately (signup API takes 12ms):
async function signup(data) { const user = await db.user.create({ data }); // 10ms await queue.enqueue("send-welcome-email", { // 2ms (just enqueue) email: user.email, }); return user; // 12ms total ← user response}// A separate worker consumes the queue and actually sends the email (in the background)Result: 510ms → 12ms. Per-request time dropped ~40x, and QPS rises with it. The email arrives a second later and nobody notices.
Good candidates to push onto a queue:
-
Email/SMS, push notifications
-
Image resizing / thumbnail generation
-
Stats / analytics aggregation
-
Third-party API calls (slow, failure-prone)
Tools: Kafka, RabbitMQ, Redis Streams, AWS SQS, etc. As a bonus you get retries and failure isolation for free — if the email server is briefly down, jobs pile up in the queue and send once it recovers, while signup itself never blocks.
3-2. Batching — “collect many, do them at once”
Every network/DB round-trip has a fixed cost. Sending 100 items one-by-one (100 trips) is far more expensive than bundling them into a single trip.
Classic example — sending analytics events:
// Before: send on every event → 1000 round-tripstrack(event) { await http.post("/analytics", event); }
// After: buffer, then send once per 100 events or every 1s → 10 round-tripsconst buffer = [];track(event) {  buffer.push(event);  if (buffer.length >= 100) flush();}function flush() {  http.post("/analytics/bulk", buffer.splice(0));  // everything collected, in one shot}setInterval(flush, 1000); // flush every 1s even if 100 isn't reached
Fixing N+1 queries is batching too (the DataLoader pattern):
// Before (N+1): 10 posts → 10 separate author lookupsfor (const post of posts) {  post.author = await db.user.findUnique({ where: { id: post.authorId } });}// 1 (posts) + 10 (authors) = 11 queries
// After (batched): collect author ids into one IN-queryconst authorIds = posts.map(p => p.authorId);const authors = await db.user.findMany({ where: { id: { in: authorIds } } });// 1 + 1 = 2 queries  (DataLoader does this collecting automatically)
💡 What I shipped — the “50ms-window notification aggregation” on 3w CMS
In our notification system, a single user sometimes got a burst of events in a tiny window (e.g., 10 messages in a group chat within one second). Firing a push per event meant:
-
The user’s phone buzzed 10 times → terrible UX
-
10 outbound calls to the push provider (FCM/APNs) → load + cost
Fix — bundle within a 50ms window: when a notification arrives, don’t fire immediately. Wait 50ms; if more notifications for the same user arrive, merge them and send one “10 new messages” push.
// Open a 50ms window per user and collect notifications that arrive within itfunction onNotification(userId, payload) {  if (!windows.has(userId)) {    windows.set(userId, { items: [] });    setTimeout(() => flushWindow(userId), 50);  // send once, 50ms later  }  windows.get(userId).items.push(payload);}
function flushWindow(userId) {  const { items } = windows.get(userId);  windows.delete(userId);  // one item → send as-is; many → merge into "N new notifications" and send once  sendPush(userId, summarize(items));}
Result: during bursts, push calls dropped to a fraction of before, and users got one clean summary instead of a notification bomb. Performance and UX, fixed in one move. 50ms is imperceptible to a human, so the trade-off was practically free.
3-3. Debouncing / throttling — batching on the client side
Rapidly repeating requests, like search autocomplete, should be bundled or thinned out.
-
Debounce: “fire one request only after 300ms of no further input.” Type
S,Se,Seoulwithin half a second → not 3 requests, just 1 forSeoul. -
Throttle: “at most once per second, no matter how often it fires.” Thins out things like scroll events that fire hundreds of times a second.
Blocking on the client is the cheapest optimization of all, because the request never reaches the server.
Conclusion
There’s plenty beyond these three — horizontal scaling (load balancer + multiple servers), HTTP/2, gzip/brotli compression, separating static assets — but applying just these three properly usually lifts QPS by 10x or more. So when you start tuning, you almost always go in this order (best bang-for-buck first):
| Order | Strategy | What it attacks | One-liner |
|---|---|---|---|
| 1 | Caching | Per-request time (denominator) | Store expensive results in a cheap place, reuse |
| 2 | DB optimization | Per-request time (denominator) | Index the query, pool the connections, replicate the reads |
| 3 | Async / batching | The amount of work | Pull non-essential work out of the response path |
The key is that the three multiply. Caching keeps 80% of reads from ever reaching the DB (5x), indexes speed up the remaining 20% (10x), and heavy work moves to a queue — the gains don’t add, they compound, and total QPS jumps by tens of times.
And the thread running through all three: consciously choosing your trade-offs. View counts can lag 5 minutes, notifications can bundle for 50ms, emails can arrive a second late. Knowing what’s allowed to be slightly wrong or slightly late — that’s the real skill in performance engineering.
Thanks for reading! If you’ve shipped a performance fix that fit one of these buckets — or broke one of these rules and paid for it — I’d love to hear about it in the comments.
Comments