
[Messenger Load-Testing, Part 1] Building a Reusable Load-Test Environment — Make-based IaC, Observability, and Auth Seeding
How many TPS can a messenger's send API survive, and where exactly does it break? A 7-node mirror of production, rebuilt on demand from a single Makefile target.
On this page
- Introduction
- Why “100 MPS” isn’t an answer
- Topology
a faithful copy of production
- Reusable infrastructure
Makefile + Terraform as a single entry point
- Observability
tuning without measuring is just guessing
- Auth / authorization seeding
- Sender / receiver split measurement architecture
- Execution flow
12 fixed steps
Abort criteria - Conclusion
Introduction
I wanted to know exactly how many TPS our messenger’s send API could survive — and where it would actually break. So I mirrored production into a 7-node load-test environment, and instead of treating it as a one-shot setup, I designed it to be reproducible on demand.
This post is a record of that process — what we wanted to measure, what had to be prepared first, and how the environment itself was wrapped so anyone can re-run the whole thing.
Why “100 MPS” isn’t an answer
People love to say “our service handles 100 MPS.” Try answering any of the following with just that number:
-
At what WebSocket concurrency was the 100 MPS measured?
-
What message type? (Plain text? Mentions? Attachments?)
-
Into what kind of channels? (5-member? 50-member? Thousands?)
-
For how long did the load hold?
-
What did CPU, DB connections, Redis, Centrifugo look like during the run?
-
What were the 4xx / 5xx rates and the REST→WS p95/p99 delivery latency?
A single number that strips all of those variables is meaningless. So the goal of this project was not “produce a bigger number” — it was “build a measurement environment that can answer all of the above.”
There was one more design rule.
Don’t load a single channel with thousands of members. Distribute the load across hundreds of small channels (5-/50-member mix).
Our message API enforces a msg:{userId}:{channelId} rate limit (10 requests / 10 seconds, i.e. ~1 TPS per pair). Pile load onto a single channel and you hit 429 right around 100 TPS, well before any real backend pressure shows up. To exercise 1k TPS under production-like conditions you need at least 1,000 distinct sender/channel pairs, ideally 2,000+. The dataset itself has to be designed around the production traffic shape.
Topology — a faithful copy of production
If the test topology differs from production, the numbers will too. So we provisioned 7 Vultr VMs on the same plans as production, including the separate ALB layer.
k6 / WS Client    │    │ HTTP /api/*  +  WS /connection/*    ▼HAProxy ALB    │ :80   public    │ :8000 internal Centrifugo API    │    ├── /api/*, /api/centrifugo/* ──► Next.js App    │                                      │    │                                      │ App → HAProxy:8000 publish    │                                      ▼    └── /connection/* ───────────────► Centrifugo C1 / C2 (round-robin)                                              │                                              ▼                                       Redis (broker / cache / rate limit)
Next.js App writes → PostgreSQL| Host | Role | Plan |
|---|---|---|
HAProxy | HAProxy ALB | 2C / 8GB |
app | Next.js web | 2C / 8GB |
centrifugo-1, centrifugo-2 | Centrifugo v5 (RR) | 2C / 8GB ×2 |
postgres | PostgreSQL + production dev dump | 2C / 8GB |
redis | broker / cache / rate limit | 2C / 8GB |
client | k6 sender + Go WS receiver | 4C / 8GB |
Reusable infrastructure — Makefile + Terraform as a single entry point
The biggest trap with a load-test environment is “set it up once, never touch it again.” When a 1k TPS smoke breaks the DB and you come back a week later to run a knee sweep, if anyone has to remember the PG password or where cloud-init last stalled, the whole afternoon is gone.
So everything is wrapped into one Makefile-driven flow. Terraform manages all 7 hosts in a single state, and Make sequences up → wait → cutover → smoke → down on top of it.
# standard flowmake up # provision 7 VMs + cloud-init + auto-refresh HOSTS.envmake wait # wait for cloud-init on all 7make secrets-check # verify compose/.env (HMAC, API key) consistencymake cutover # deploy HAProxy → App → Centrifugomake smoke # /healthz, /api/health, publish, RR distribution checksmake down # destroy all 7Three details matter.
(1) Terraform output → scripts/HOSTS.env auto-refresh. IPs are never hardcoded — not in the README, not in scripts. After make up, env vars like HAPROXY_IP, APP_IP, CENTRIFUGO_1_IP, … are populated automatically, and every downstream script starts with source scripts/HOSTS.env. IPs can change without a single line of code being touched.
(2) The secrets-check gate. If App and Centrifugo end up with different HMAC secrets, JWT verification silently fails everywhere. Hunting that down manually eats an hour. So before cutover, we automatically verify CENTRIFUGO_HMAC_SECRET_KEY matches between compose/.env.app and compose/.env.centrifugo.
secrets-check: @A=$$(grep '^CENTRIFUGO_HMAC_SECRET_KEY=' compose/.env.app); B=$$(grep '^CENTRIFUGO_HMAC_SECRET_KEY=' compose/.env.centrifugo); [ "$$A" = "$$B" ] || { echo "ERR: app/centrifugo HMAC mismatch"; exit 1; }(3) PG data preservation (dump-pg / restore-pg). Vultr VMs are billed even in the stopped state, so the natural cycle is “tear down after a run, spin up next time.” But that cycle is dangerous if it loses the PG seed in between.
make dump-pg # dump current PG VM → data/postgres-dumps/make list-dumps # list saved dumpsmake restore-pg # auto-restore the latest dump to a fresh PG VMmake restore-pg DUMP=data/postgres-dumps/app-XXXX.dump # pin a specific dumpAfter restore, the script automatically prints ANALYZE results, table counts, DB size, and row counts for top tables — so nobody has to manually verify “did the restore actually work?”
Once wrapped this tightly, a new teammate or a future sprint can rebuild the environment with five commands. That’s what “reusable” actually means here.
Observability — tuning without measuring is just guessing
Observability has to be alive before load goes in. Discovering breakage by running blind first is too late. So the monitoring stack was the first thing built, not the last.
| Layer | Tool | Where |
|---|---|---|
| Metric store | Prometheus | local Mac (localhost:9090) |
| Dashboard | Grafana (provisioning) | local Mac (localhost:3000) |
| System metrics | node_exporter | all 7 VMs (:9100) |
| DB metrics | postgres_exporter | Postgres VM (:9187) |
| Cache metrics | redis_exporter | Redis VM (:9121) |
| Infra metrics | HAProxy / Centrifugo /metrics | each VM |
| Load metrics | k6 → Prometheus remote-write | client VM → Mac (SSH reverse tunnel) |
Setup is three commands:
docker compose -f monitoring/docker-compose.monitor.yml up -d./scripts/setup-monitoring-exporters.sh all./scripts/verify-prometheus-targets.shsetup-monitoring-exporters.sh is worth pointing out: it never puts PG/Redis passwords into the repo. The script SSHes into the remote VMs and reads /etc/postgres/postgres.env and /etc/redis/redis.env to build exporter-only env files there. There’s no structural way for the secret to land in a commit.
The dashboard is split the way an operator actually thinks during a run — three layers:
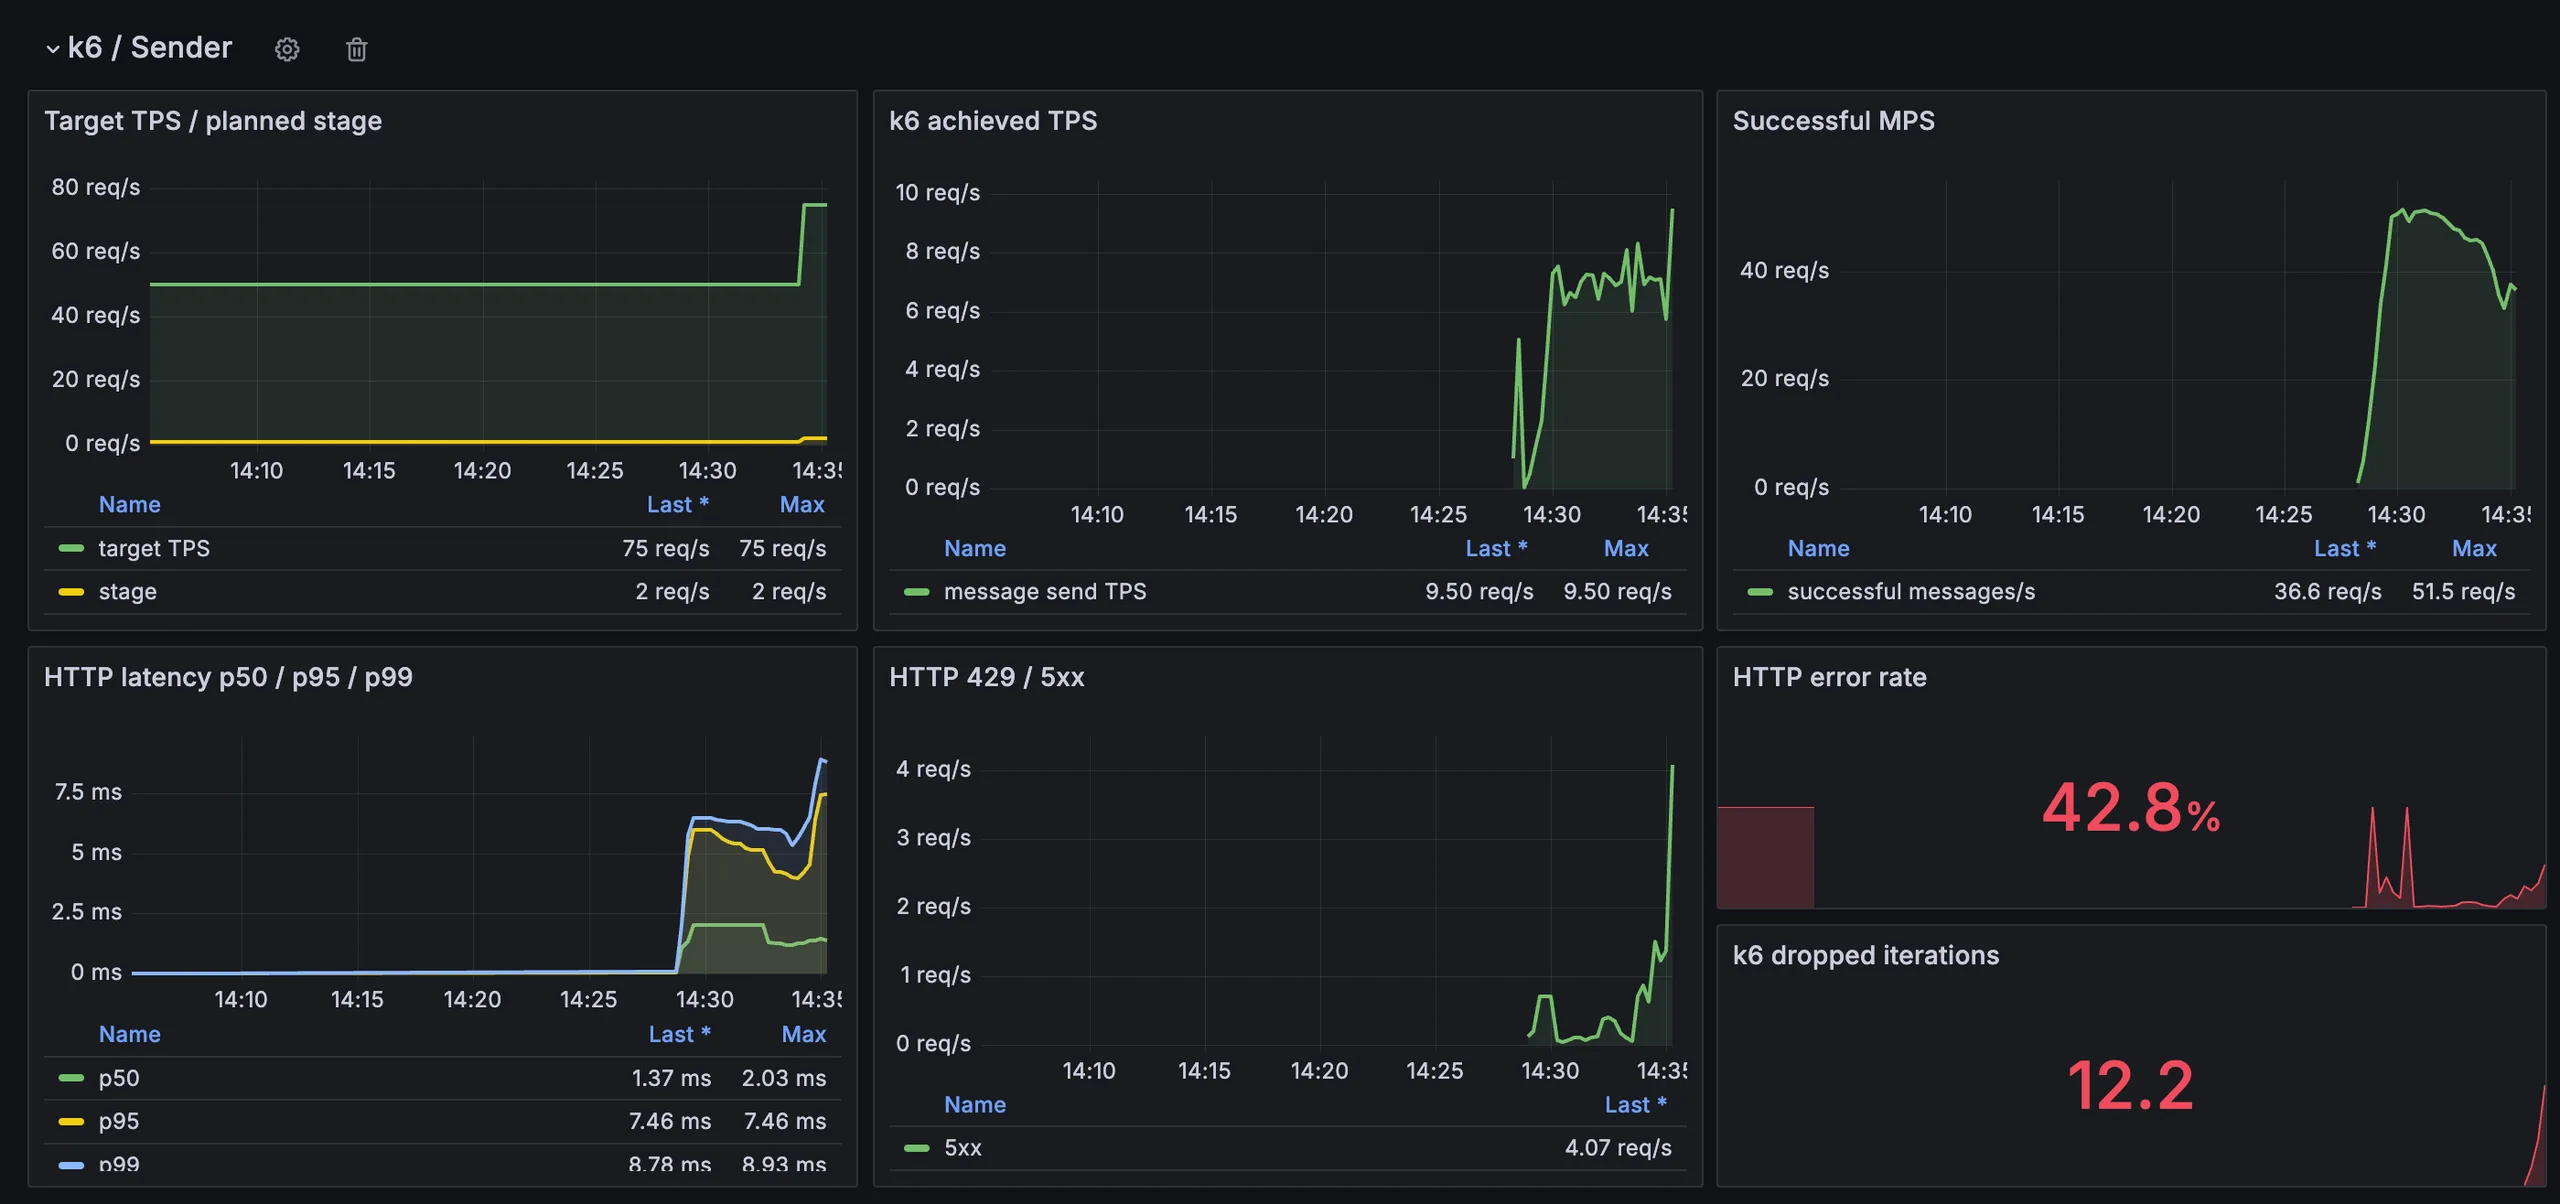
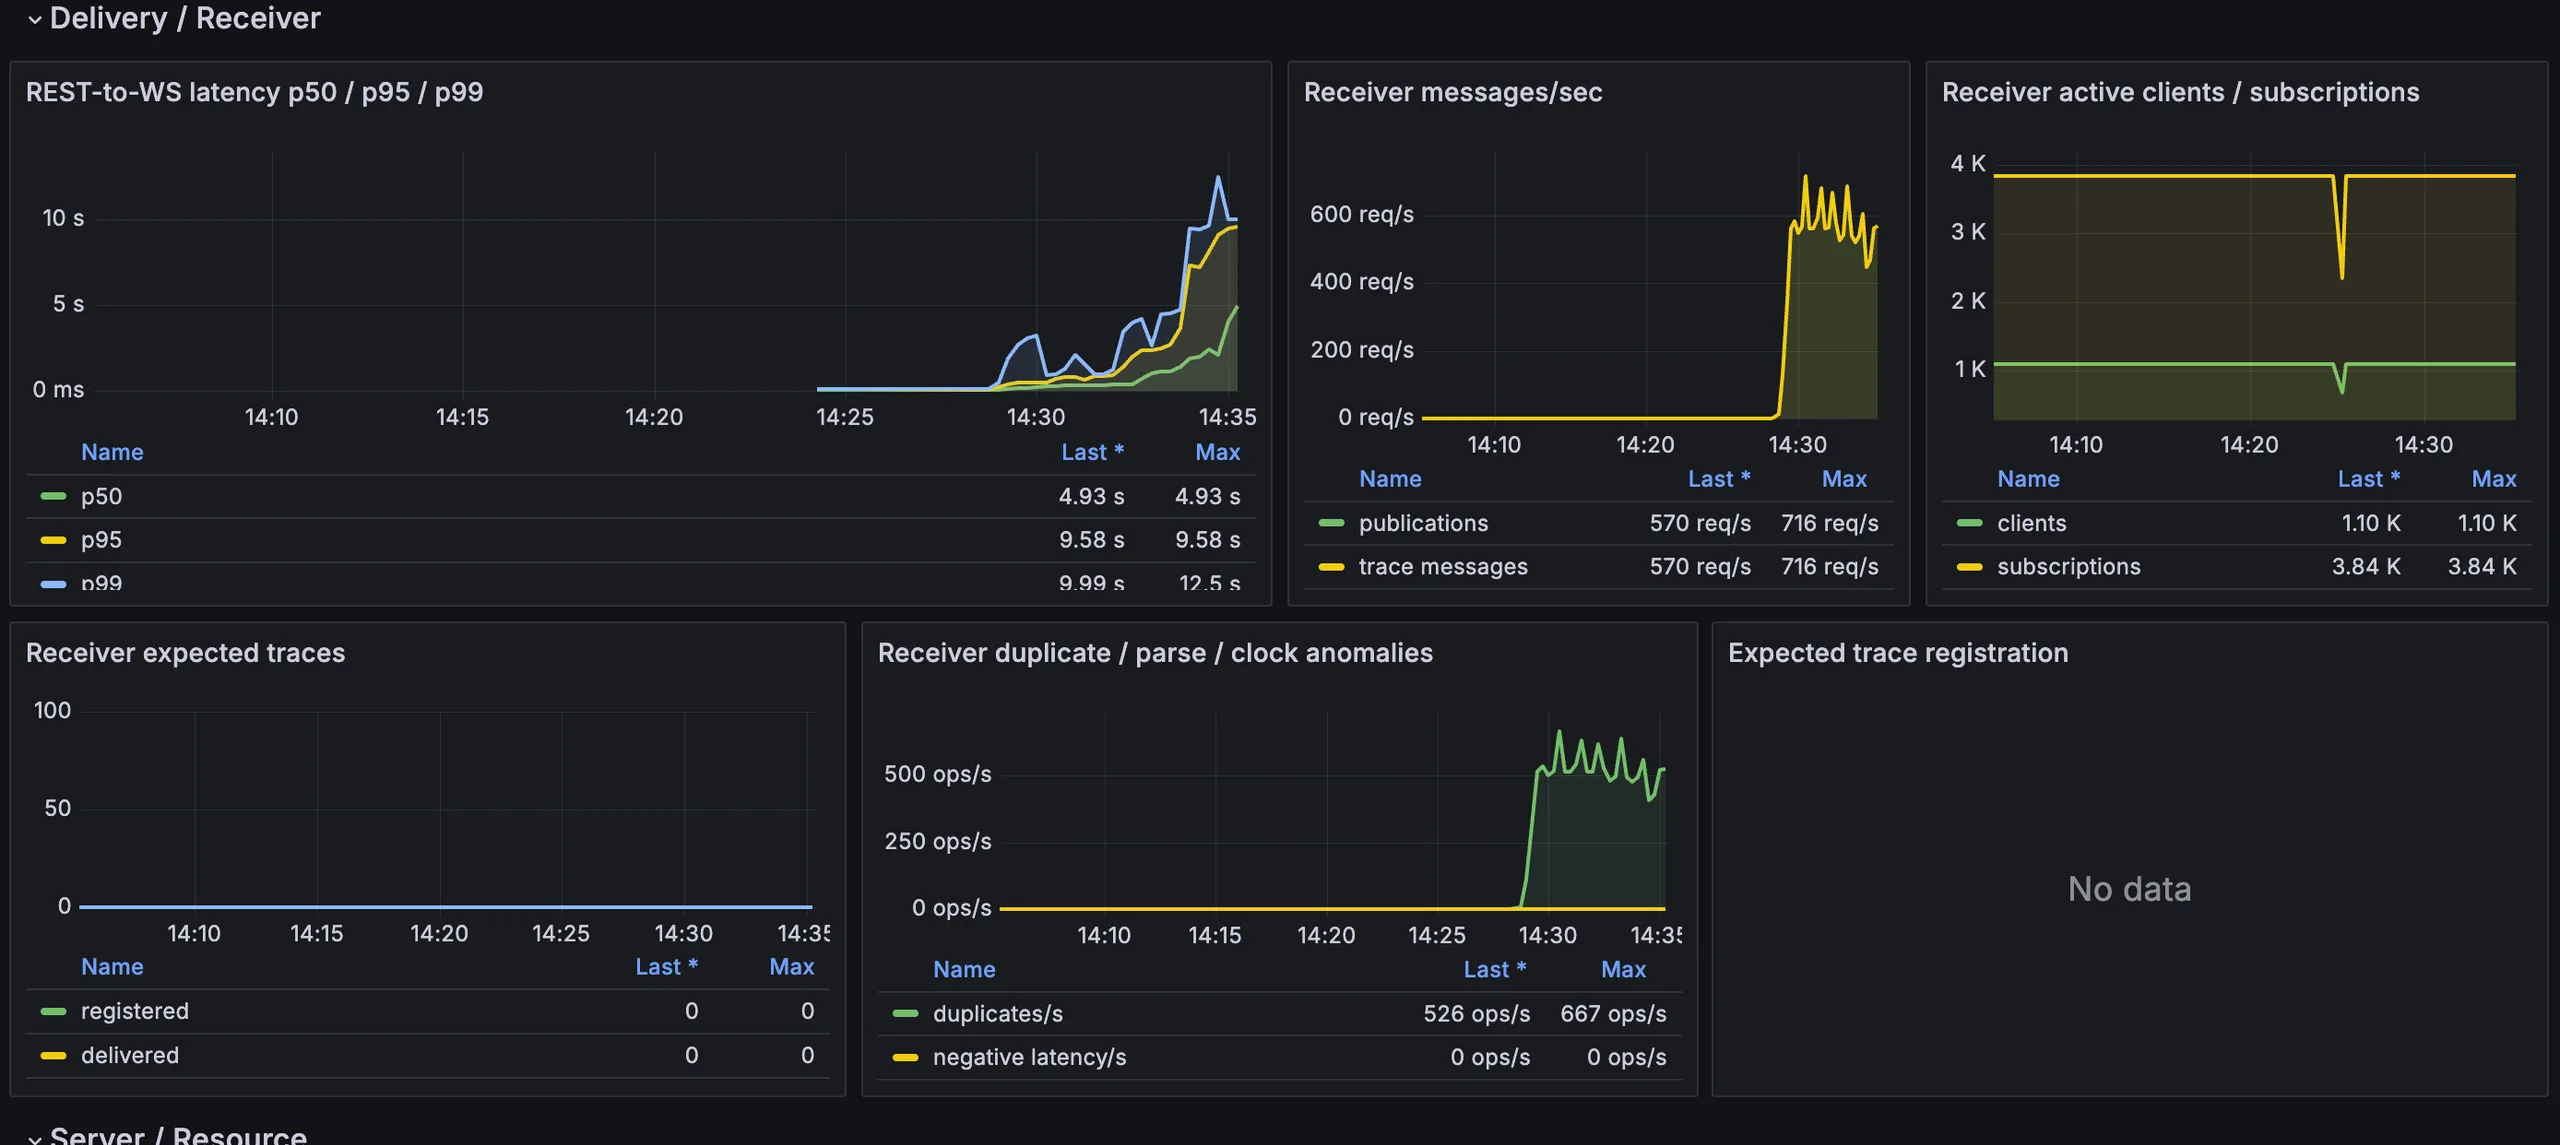
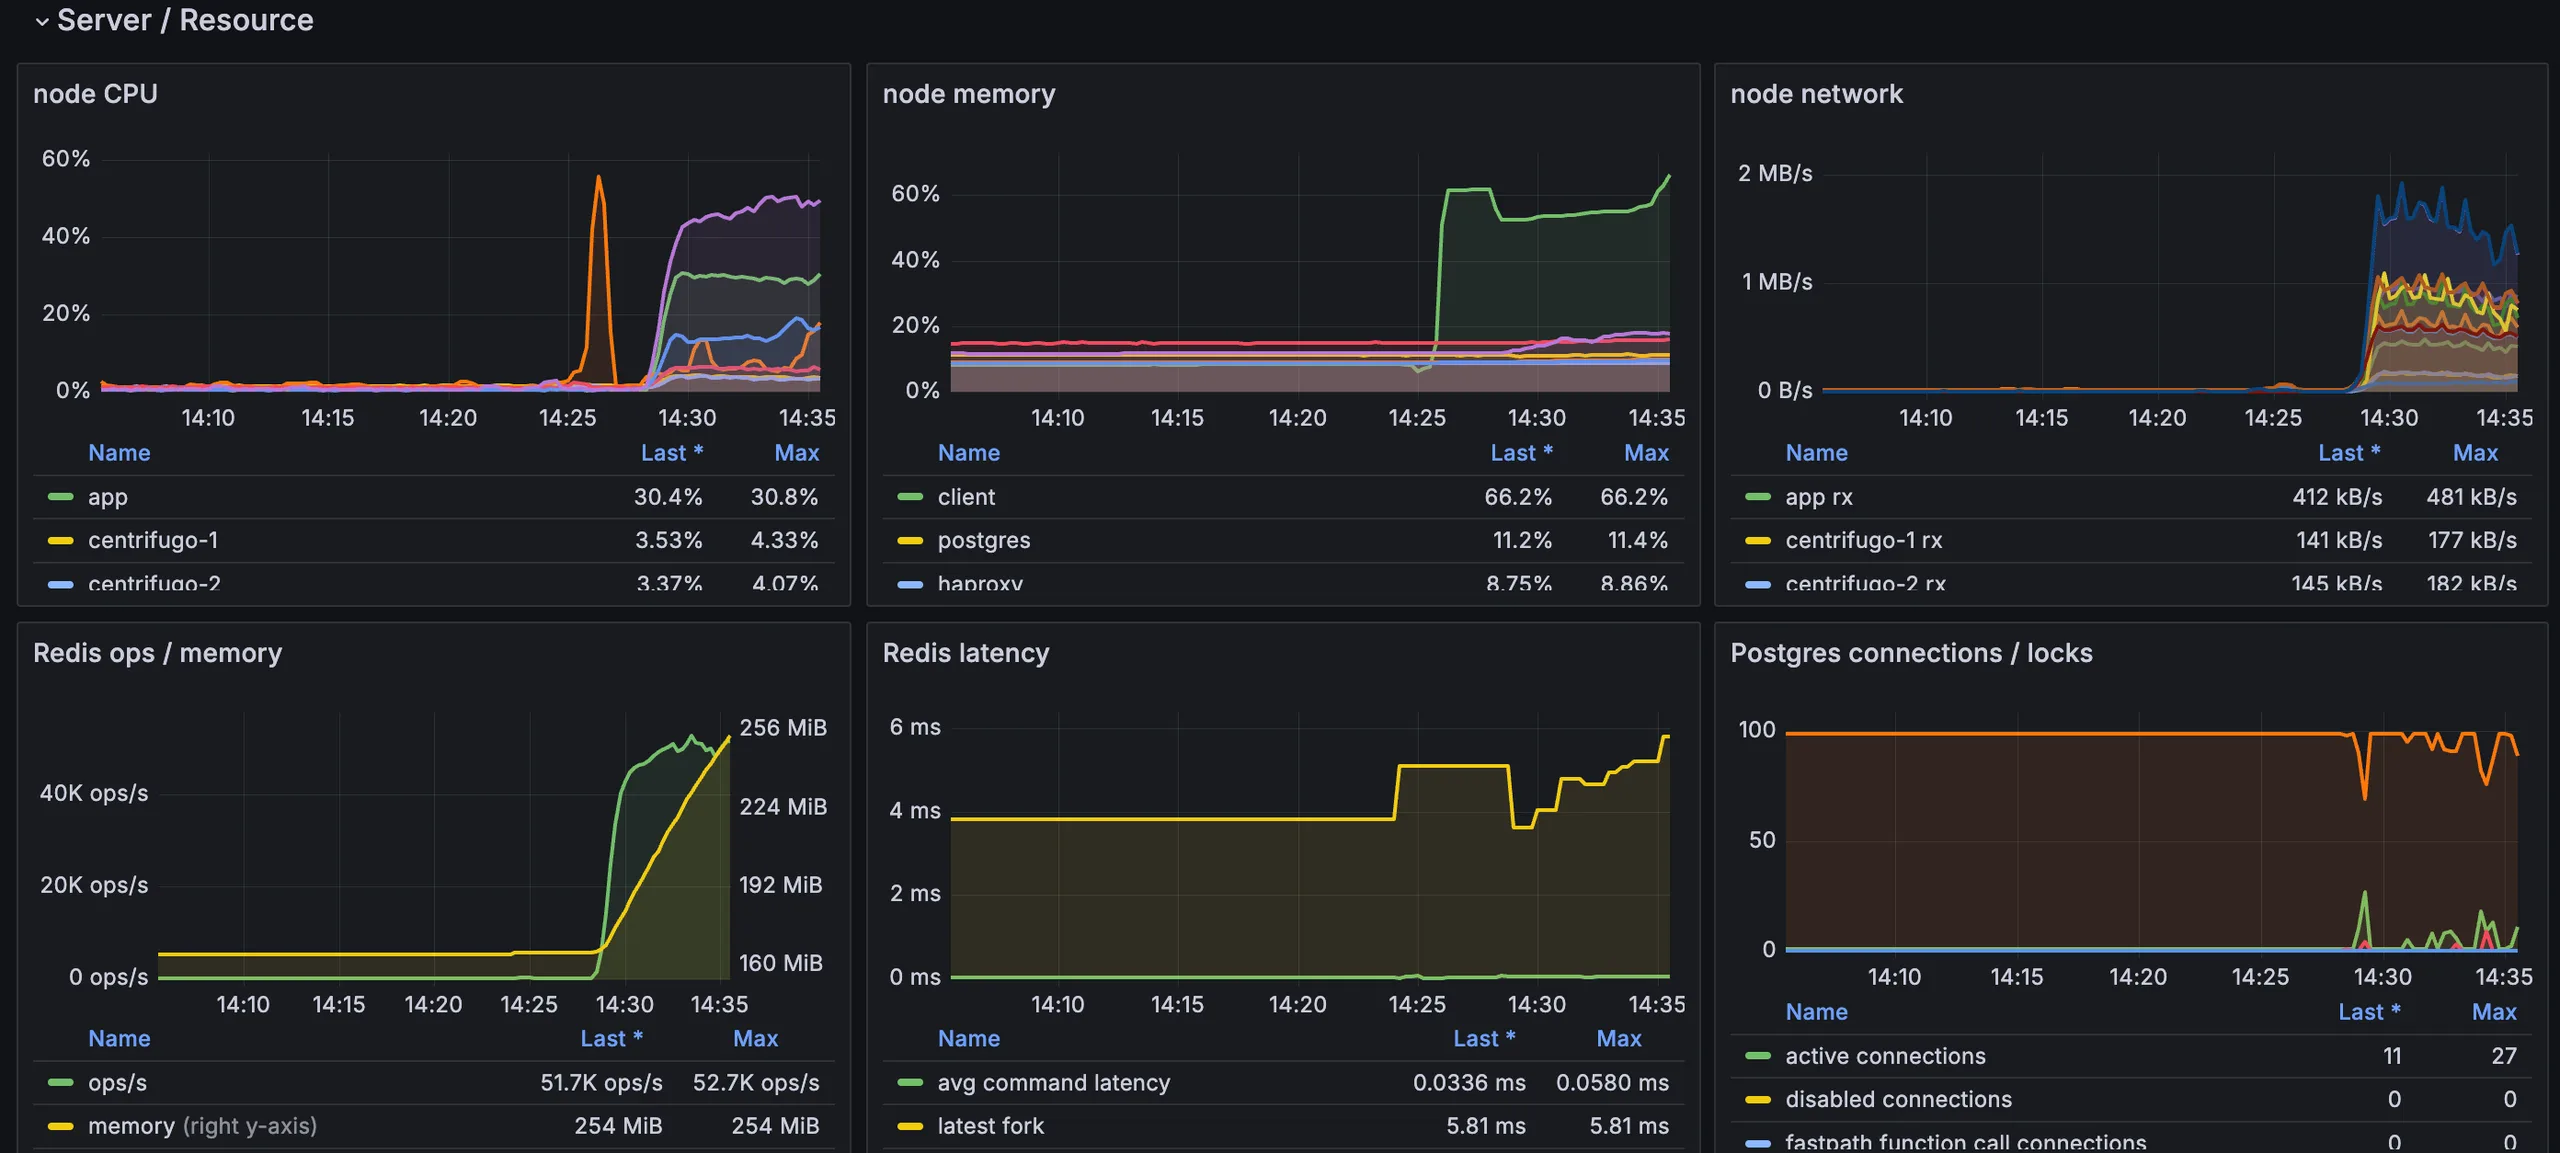
(A) k6 / Sender → how much I tried to send(B) Delivery / Receiver → how much actually arrived(C) Server / Resource → did the infra survive while that happenedKey panels per layer:
-
(A) Sender — target TPS, achieved TPS, successful MPS, HTTP p50/p95/p99, 429 / 5xx split, k6 dropped iterations (how often constant-arrival-rate failed to keep up).
-
(B) Delivery — REST-to-WS p50/p95/p99, receiver msgs/sec, active clients/subscriptions, expected traces (registered / delivered / pending), and anomalies (duplicate / parse failure / negative latency).
-
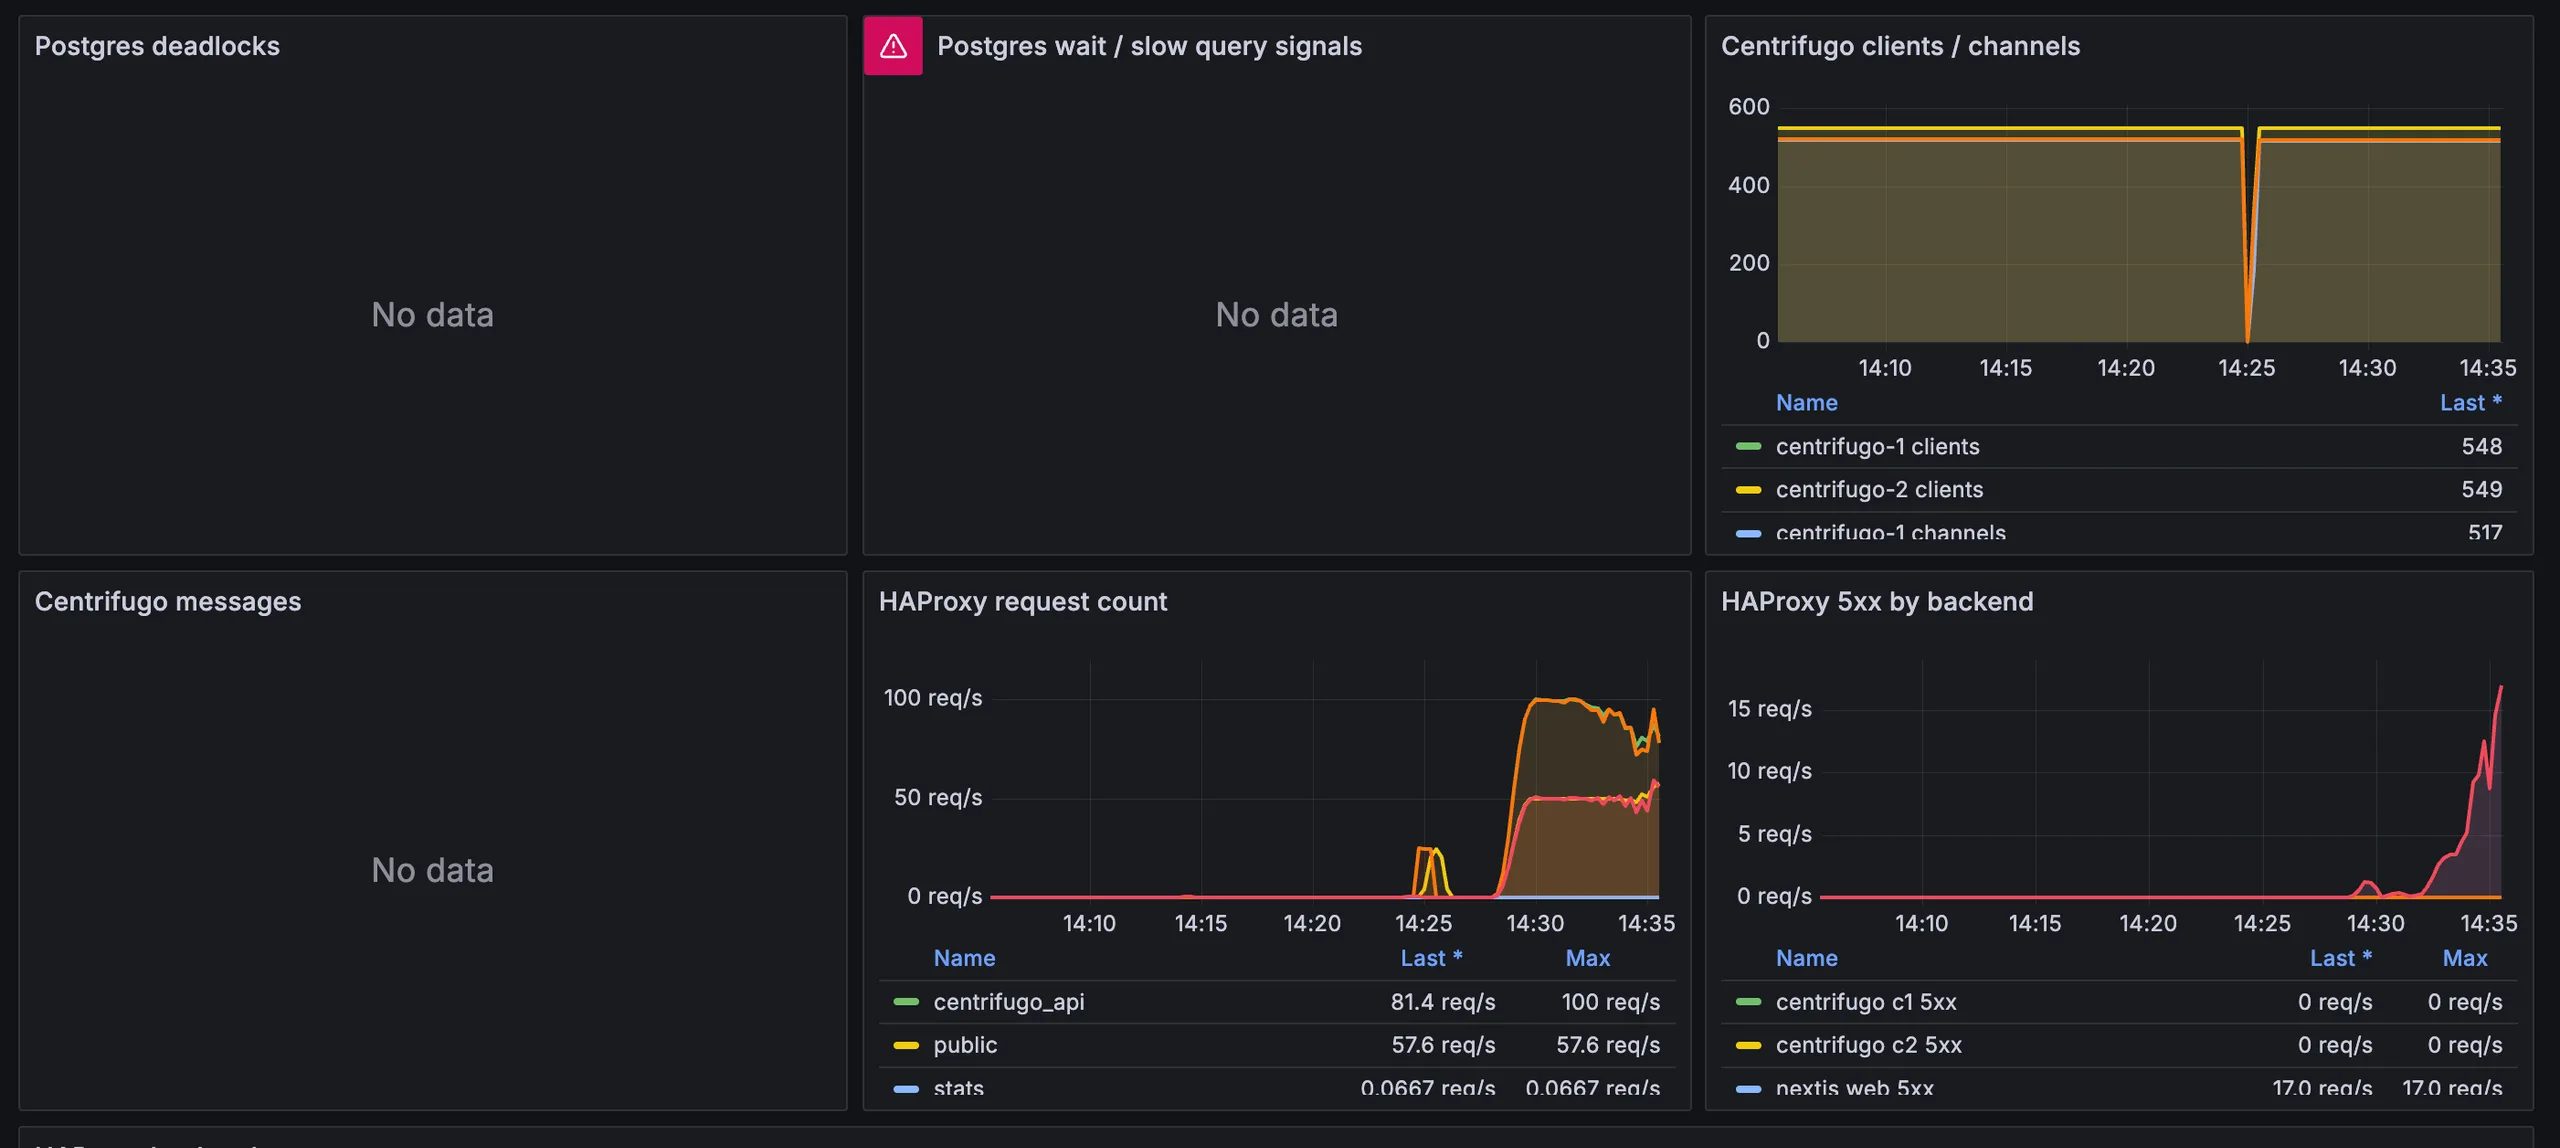
(C) Server — node CPU/memory/network, Redis ops/memory/latency, Postgres connections/locks/deadlocks, Centrifugo per-node client/channel distribution, HAProxy 5xx by backend.
The value of this split is how fast you can isolate the cause. When 5xx spikes, if (B) latency is fine but (C) shows Postgres connections climbing — it’s the DB pool. No guessing.
Auth / authorization seeding — the hardest part
This was the conceptually trickiest piece of the whole setup. It deserves its own section.
Why we bypass the login flow
The thing under test is POST /api/channels/{channelId}/messages — the write path. We’re measuring the cost of: auth middleware → DB write → fanout → Centrifugo publish → WS delivery at the moment a message is sent.
If you include the full login flow (OAuth callback, session issuance, token exchange), the cost of the auth service blends with the message write path and you can’t isolate where the knee actually is. So we preserve production’s auth model exactly, but pre-seed everything that happens before the message is sent.
Two different auth models, kept distinct
The product has two client classes; the load test mirrors that.
| Client | Token | Verifier | Storage lookup |
|---|---|---|---|
| k6 (REST sender) | Desktop Bearer opaque token | Next.js auth middleware | Redis (token→user) + Postgres (channel membership) |
| Go receiver (WS) | Centrifugo JWT (HS256, self-contained) | Centrifugo HMAC check | none |
The cost structures are completely different:
-
REST auth: Redis GET + Postgres SELECT per message. Cost multiplies by message count.
-
WS auth: one HMAC check at connect time. Zero cost afterwards.
That’s why we never merge the two tokens. The production cost shape has to survive into the test.
”Seeding” means serializing the auth state
The word “serialize” is the right one. We’re freezing into files the auth state that’s normally scattered across memory, DB, and Redis. The state to freeze:
-
Which users exist (
User.id, email, name) -
Which workspace each user belongs to
-
Which channels each user is a member of
-
What access token to attach to each REST request
-
Which Centrifugo channels each receiver may subscribe to
All of this is serialized into nine data/generated/*.jsonl files. These files are the SSOT of the test. Postgres, Redis, and k6 must all be looking at the same snapshot at the same time — drift between them produces an immediate flood of 401/403.
The generation pipeline
data/generated/users.jsonl ← SSOT │ ├──► seed-export-postgres.js │ → Postgres: upsert Workspace / User / WorkspaceMember / │ Channel / ChannelMember │ ├──► build-desktop-bearer-tokens.js │ → tokens.jsonl (k6 attaches in Authorization) │ → redis-token-seed.jsonl (input for Redis SETEX) │ → seed-redis-tokens.sh → Redis: desktop:token:access:* │ └──► build-centrifugo-channel-allowlist.js → centrifugo-channel-allowlist.jsonl → mint-centrifugo-tokens.js (HS256 sign with CENTRIFUGO_HMAC_SECRET_KEY) → centrifugo-jwts.jsonl (Go receiver uses on WS connect)Splitting the nine files into two groups by volatility turned out to be the operationally important part.
A. Auth-independent — reusable as long as the Postgres seed survives (6 files) users.jsonl, channels.jsonl, channel-members.jsonl, sender-channel-pairs.jsonl, mention-targets.jsonl, centrifugo-channel-allowlist.jsonl
B. Expiring / volatile — re-mint or re-seed every cycle (3 files) tokens.jsonl (1-year TTL, invalidated on Redis FLUSH), centrifugo-jwts.jsonl (1-year TTL, invalidated when HMAC secret rotates), redis-token-seed.jsonl (must be re-SET if Redis goes empty).
This grouping removes the recurring “do I have to regenerate everything?” question. As long as PG/Redis are alive and the tokens aren’t expired, all nine files drop straight into the next 1k smoke or DB knee sweep.
Auth flows, end-to-end
REST sender:
k6 → Authorization: Bearer <opaque token> → Next.js auth middleware: Redis GET desktop:token:access:<token> → req.user injected → Postgres channel membership check → POST /api/channels/{id}/messagesWS receiver:
Go receiver → WS connect with token=<JWT> → Centrifugo: HS256 signature + exp check (no Redis/PG lookup) → subscribe chat:*Pre-seeded auth is standard practice for message-path load tests. The goal isn’t to benchmark the auth product itself — it’s to find the knee in the message write path and fanout path.
Sender / receiver split measurement architecture
This is the core design choice of the load model.
[ client VM ] k6 (REST sender) ──HTTP──► HAProxy ──► App ──► (publish) ──► Centrifugo │ ▼ (fanout) Go receiver (WS) ◄────────────────────────── Centrifugo ◄────────┘Why send and receive don’t live in the same process:
-
k6 is optimized as an HTTP load generator. Bolting a WS subscriber onto it warps the generator-side load curve.
-
The Go receiver holds 1,000+ concurrent WS connections and has to perform traceId matching + latency measurement per message. A goroutine/channel model fits naturally.
-
Each side doing only its own job is what makes “which side is the bottleneck?” answerable.
Trace measurement — true REST → WS E2E latency
When k6 sends a message, it embeds metadata.clientTrace.traceId and sentAt in the payload. When the Go receiver gets a publication from Centrifugo, it matches by traceId and records now - sentAt.
sender POST timestamp ─────────────► receiver WS receive timestamp ▲ ▲ sentAt recorded latency = now - sentAtThat value is the real REST-to-WS delivery latency p50/p95/p99 — not HTTP response time, but “how long from send until the message appears on someone else’s screen.”
Turn on EXPECTED_TRACE_MODE=direct and every successful send also registers its traceId at the receiver’s /expected endpoint. The receiver now knows exactly which traceIds were supposed to arrive, which gives:
-
registered— traceIds registered -
delivered— traceIds actually received -
pending— registered but never delivered (loss candidates) -
duplicate— same traceId received multiple times -
negativeLatency— clock skew suspects
At end of run, pending should converge to 0. Whatever’s left is lost messages.
k6 scenario shape
export const options = { scenarios: { chat_smoke: { executor: 'constant-arrival-rate', // arrival-rate based, not VU based rate: targetTps, timeUnit: '1s', duration, preAllocatedVUs, maxVUs, }, }, thresholds: { http_req_failed: 'rate<0.01', http_req_duration: 'p(95)<1000', dropped_iterations: 'count<1', message_send_429_total:'count<1', message_send_5xx_total:'count<1', },};constant-arrival-rate is the key. With VU-based scenarios, slower responses just lower the arrival rate, and you can’t tell “did we fail to generate load, or did the server refuse it?” Arrival-rate-based means when the server can’t keep up, dropped_iterations rises and the truth is visible.
The DB knee sweep takes this further: it auto-sweeps 50, 75, 100, 125, 150, 200, 250, 300, 400, 500, 650, 800, 1000 TPS with a 1-minute ramp + 5-minute plateau per stage. One run and the knee point is right there on the chart.
Execution flow — 12 fixed steps
For an environment to be genuinely reusable, the number of things humans have to remember has to be small. So a single load-test run is fixed into 12 ordered steps:
0. Set working directory + source HOSTS.env1. Save existing PG dump (make dump-pg)2. Provision 7-host infra (make up → make ssh-test)3. Restore DB (make restore-pg)4. Deploy apps (make secrets-check → make cutover → make smoke)5. Bring up monitoring (docker compose up + install exporters)6. Seed/export test data (data:seed-postgres, data:validate)7. Refresh JWTs + Redis seed (tokens:desktop-bearer, tokens:centrifugo)8. Upload artifacts to client VM (upload-loadtest-data.sh, upload-k6-scripts.sh)9. Reset App connection pool (docker restart witim-web)10. k6 REST smoke probe (chat-smoke.js, 30s)11. Open the 3-terminal session (receiver / Prom reverse tunnel / k6 sender)12. Monitor abort criteriaStep 11 — the three-terminal pattern — is what gets used in every run:
-
Terminal 1: Go receiver on the client VM — WS connections + trace matching + metric exporter.
-
Terminal 2: SSH reverse tunnel so k6 on the client VM can reach the local Mac’s Prometheus remote-write endpoint.
-
Terminal 3: k6 sender on the client VM, streaming metrics out via Prometheus remote-write.
# Terminal 2: SSH reverse tunnel (k6 → Mac's Prometheus)ssh -i "\(SSH_KEY" -N -R localhost:9090:localhost:9090 "\)SSH_USER@$CLIENT_IP"The reverse tunnel is what makes k6 metrics show up in real time on the local Grafana dashboard. You watch the load break, in motion, and stop it the moment it does.
Abort criteria
If any of these become true, abort before overload and recovery curves bleed into each other:
message_send_5xx_total > 0dropped_iterations > 0 (reproducibly)HTTP p95 ≥ 1sREST-to-WS p99 rising into secondsPostgres connection exhaustion in logsPostgres deadlocks repeatingclient CPU pinned at 80–90% AND achieved TPS falling behind targetWhy write these down ahead of time? Simple: if “should we keep going?” gets answered on gut feel mid-run, the resulting report loses credibility.
Conclusion
About 7–8 minutes into chat-knee-sweep.js, just as the sweep stage stepped from 75 TPS to 100 TPS, we caught this dashboard snapshot. What makes the moment interesting is that infra resources are barely touched, yet HTTP error rate spikes to 42.8% — a clear signal that the knee isn’t a resource ceiling, it’s something inside the app’s processing path.
The dashboard is read in the three-layer order set up earlier: (A) k6 / Sender → (B) Delivery / Receiver → (C) Server / Resource.
(Continued — “I’ll dig into the app server logs in the next post and unpack the cause of the 42.8% HTTP error rate*.)*
Thanks for reading. If you’re running a similar measurement effort, the two patterns most worth taking from this post are probably “wrap IaC + deploy + smoke + seeding + teardown into one Make-driven flow” and “serialize the auth state into files and treat them as the SSOT.” Those are the two things that decide whether the environment is reusable or just a one-shot.
Comments